Stop Recurring Defects!
The 8D-Report is a systematic approach that prevents problems from coming back. This video walks through all 8 disciplines from team formation to root cause analysis to permanent corrective action. See how a pizza delivery problem gets solved using the 1-5-20 day timeline, ensuring issues are fixed at the root cause level.
You'll learn: The 8 disciplines step-by-step • Root cause vs symptoms • The 1-5-20 timeline rule
Video Transcript
What is an 8D report? Ever been in a situation at work where something went seriously wrong and everyone's pointing fingers, customers are complaining about reduced quality, and sales are low? Worst of all, nobody's really sure what actually happened. Well, that's where the 8D report comes in.
It isn't just another boring form. It's actually a powerful step-by-step tool for solving problems and finding the root cause. And today, we're breaking it down.
First things first, the 8D report stands for eight disciplines. It's basically a structured approach to problem solving. Think of it as a bunch of detectives putting their heads together to crack a case. You gather your crew, investigate what went wrong, fix it, and make sure it stays fixed.
The number eight makes it sound like a really long process, but it's not. It's just a fancy way of saying there are eight clear steps to follow because the goal is to solve problems at their root and not just slap a band-aid.
Let's walk through the eight steps one by one using our Zero Defect Pizzeria example. The first step of doing an 8D report is building a team. You can't do it solo. Bringing together different people gives you the right mix of skills and knowledge.
If you're fixing a pizza delivery problem, you want someone from the kitchen, a delivery driver, a customer service rep, and the manager. Why? Because it gets you all the perspectives you need to really understand the problem.
The next step is identifying the problem exactly. Vague complaints like "stuff keeps breaking" won't work. You need specifics: What happened? Why did it happen? How often does it happen? Who noticed it? How badly does it affect your services?
For example: "On Friday nights, 20% of pizzas arrive more than 30 minutes late and are cold when delivered." Remember, the more detailed you are here, the better.
Once you have a clear picture of what's wrong, it's time to slap a band-aid on it. We did say that's not the goal here, but the purpose of putting a temporary fix in place is so things don't get worse while you figure out what's really going on.
In our pizzeria example, the manager can start double-checking oven temperatures before every shift, or think about bringing on another delivery driver on Fridays. Temporary solutions that keep the sales going and the customers happy.
When you have a handle on things, it's time to use your brain and play detective. Everyone on the team you built tries to figure out what's really causing the problem. You can use tools like the 5-Whys or the Ishikawa diagram during this part.
In our pizza shop, maybe you discover the oven loses heat after the dinner rush or the delivery route software isn't optimized. The goal here is to not stop until you're sure you found the actual root cause and not just a symptom.
Don't try any shortcuts here either. This step is the most important part of an 8D report because without knowing the root cause, you cannot correct the problem and you'll find yourself in the same shoes again.
Once you know what's really wrong, it's time to brainstorm solutions that will fix the problem for good. The team comes up with ideas, you pick the best ones and test them out.
The manager at the pizza shop can think about upgrading the oven or switching to better insulated boxes. Remember, you're still testing to make sure whatever solution you come up with really works.
Once you choose the best solution, it's time for the next most obvious step: implementation. Roll it out everywhere and whenever it's needed. Train your team, update your process, and make sure everyone gets the memo.
For example, if the manager chooses to switch to new pizza boxes, they need to ensure that every delivery driver has them, inform the supplier, and make it clear to everyone why the change is being made.
Now, you could stop there, but you'll be opening up to recurrences later on. That's why the seventh step is all about avoiding that to make sure the problem doesn't sneak back in. Update your training manuals, change your checklists, maybe even tweak your software.
You want to close the loop so the same issue can't happen again, even if people change jobs or new staff come in. An important step to prevent recurrences is to update the control plan in the FMEA (Failure Mode and Effects Analysis).
The pizza manager can put up notices and discard old boxes. Besides updating the FMEA and the control plan, the manager also notifies other outlets about the update and keeps a lookout for any other items on the menu that might be at risk of running into the same issues.
Once that's checked off, it's finally time to celebrate the win. Don't skip this. Solving big problems takes effort, and it's important to recognize the people who made it happen.
Maybe you buy everyone pizza or just give a shout-out at the next team meeting. This builds morale and encourages everyone to keep working together to solve future problems.
And that covers the eight steps of an 8D report. There's the 1-5-20 rule that you need to know. It's basically a set of deadlines that you need to follow just to make sure you're not dragging out the process.
It's pretty simple really. The first three steps need to be done in one working day, then you can take four and five days for the fourth and fifth steps, and finally for the last three steps you can take 20 days.
On first glance, the eight steps of an 8D report seem like a fancy name for a simple process. Some of you might even go, "Can't we just fix stuff as it comes up?" But see, what you need to realize is that the 8D process is a total gamechanger.
If you follow all the steps, you won't miss anything important. It's a structured breakdown. Since it's team-based, you get input from all sides. And the burden of fixing it all on your own isn't on you either.
But the best part is that you're not just fixing the current issue—you're making sure it never happens again. Also, everything is written down so you have a clear record of what happened, what you did, and why. Your future self is going to thank you when you're dealing with audits or customer complaints going forward.
Some of you might be wondering whether an 8D report can work for your business. Well, the short answer is yes. 8D reports are used everywhere—from car factories to tech companies to food production.
Any place where quality matters and mistakes can be expensive or dangerous can benefit from this approach. Automotive and aerospace industries love it, but so do smaller businesses that want to show customers they take problems seriously.
However, not all of it is a walk in the park. There are some limitations that you need to be aware of as well, like the fact that the process demands resources and time. It's something you can work on in the background.
Also, it's not exactly a one-size-fits-all solution. For minor problems, it might be a bit too extensive, demanding paperwork and resources when it's not needed. Finding that balance is up to you.
Finally, you need to remember that you are working with a team. So, the success of an 8D report will eventually come down to how well your team members are able to identify the problem and analyze its effectiveness using different tools.
To make sure your 8D report brings results, you can keep some tips in mind:
Be honest. Don't sugarcoat the problem or skip steps. Get everyone involved. The best solutions come from teamwork. Keep it clear. Use simple language and specific details. You don't want to decode your own words later on and waste time.
And most importantly, follow up. Check to make sure your fixes are still working weeks or months later.
At the end of the day, an 8D report isn't just paperwork—it's a blueprint for real lasting solutions. It helps teams get to the bottom of problems, fix them for good, and make sure they don't come back.
So, next time something goes wrong, don't panic or point fingers. Instead, grab your co-workers and a pen and start brainstorming.
What is an 8D-Report?
The 8D Report, called the Eight Disciplines, is a method for solving problems and a tool used in quality control.
The 8D method has eight parts, each a step in solving a problem. These steps are forming a team, stating the issue, taking temporary actions, finding the main cause, applying fixes, checking if they work, stopping problems from happening again, and appreciating team work.
It gives a clear way to find, fix, and stop problems, helping organizations improve all the time.

Apollo 13 – The Ultimate 8D-Report
This guide shows how the Apollo 13 team used a structured 8D approach to solve a life-threatening crisis. You see how each step helped the crew find the root cause, build fast countermeasures, and bring the astronauts home. The guide helps you understand the 8D method and apply it to tough problems in your own work.

Why Use the 8D-Report?
The main goal of the 8D Report is to find the main reason for a problem, take corrective steps, and stop the issue from happening again. This helps organizations to enhance processes, cut down on defects, and lessen the effect of problems on product quality and customer satisfaction.
The goal is to remove the root cause instead of just addressing the symptom.
When to Use the 8D-Report
The 8D Report is a reactive tool mainly used in manufacturing, automotive, and other sectors to solve complex problems like defects, deviations, logistic issues and customer complaints when the underlying root cause is unclear. It plays a key role in quality management systems, assisting companies in improving product quality and customer satisfaction.
When picking a problem-solving tool, it is important to think about the issue’s complexity, urgency, and type.

JDI ("Just Do It")
Basic, everyday problems that one person or a small group can quickly fix without formal methods are good for do-it-yourself (DIY) solutions.
The DIY (Do It Yourself) method is ideal for straightforward issues that individuals can resolve through immediate action and common sense, without requiring formal procedures or extensive documentation
PDCA
The PDCA/A3 Method helps teams to plan, implement, and check solutions in a structured way, for internal problems that need order but are not pressing.
The PDCA (Plan-Do-Check-Act) cycle is a continuous improvement method that guides teams through a systematic process of planning actions, implementing changes, checking results, and acting on lessons learned for ongoing improvements.
A3
The PDCA/A3 Method helps teams to plan, implement, and check solutions in a structured way, for internal problems that need order but are not pressing.
The A3 Method, named after the paper size traditionally used for the report, is a structured problem-solving approach that tells the complete story of a problem on a single page, forcing concise documentation while walking through background information, current conditions, root cause analysis, proposed countermeasures, and follow-up actions.

8D Report
The 8D (Eight Disciplines) process is specifically designed for complex quality issues and customer complaints, requiring a thorough, documented approach that includes containment actions, root cause analysis, and verification of corrective measures.

6σ Six Sigma
Six Sigma (6σ) represents the most rigorous and resource-intensive methodology, typically reserved for chronic, high-impact problems that require statistical analysis and long-term process improvement to achieve near-perfect quality levels.

How to Conduct an 8D-Report
D1 – Form the Team
D1.1 – Goal
“Form a team of individuals with knowledge of the product and process, abilities in different technical fields, and the time and authority to carry out actions to resolve an issue.”
So the first action in the 8D method is to create a skilled team. This team should include members with a mix of abilities, such as technical knowledge, understanding of processes, and skills in solving problems. Having team members from various areas ensures a well-rounded approach to finding solutions, as they provide different viewpoints. Good communication and working together are vital for successfully carrying out the 8D process.
D1.2 – Participants
Effective team members should be:
- Ready to help
- Able to identify issues
- Open to learning improvement methods
- Collaborative rather than individualistic
D1.3 – Team Size
A good team has 3 to 7 people. Teams with less than 3 have problems with new ideas and different skills. When teams have more than 7, they get too big to work well together.
The team can stay adaptable by bringing in or taking out experts when their skills are needed for certain tasks.

D1.4 – Cross-Functional Teams
Teams are groups gather people from various departments and outside functions of an organization. The project team is central, linking different specialized areas.

D1.5 – Why Cross-Functional Teams Matter
A mixed group of people. Working together can join their skills and know-how to fix tricky problems that one person cannot solve alone. The gains from these teams show up in important areas. For skills, teams combine more talent, more experience, wider knowledge, and better technical skill.
Communication gets better through exchanges between departments, leading to higher productivity from more idea creation and better team spirit.

D1.6 – Common Team Obstacles
Teams often find it hard when there isn’t a clear leader to put ideas into action. Not having a supporter to help the group when they need it makes things even harder. Issues between members can hurt how well a team works, like if there are fights over personalities, one person tries to take over, or negative attitudes make members doubt their role.
Things get worse when management asks too much of the team but doesn’t give enough time to meet these requests.
Team performance also drops when members don’t have basic problem-solving skills. Without clear goals or a sense of urgency, progress slows down. Furthermore, when key data and information are not available or shared properly among all team members, the team’s ability to work well is greatly affected.

D2 – Define the Problem
D2.1 – Goal
“Identify the size of the problem and its impacts in measurable terms, which leads to a better focus for finding the root cause.”
Clearly stating the problem is important for a successful 8D Report. The team needs to write a clear and complete description of the issue, looking at how it affects product quality or customer happiness. This step requires collecting useful data, customer opinions, and other important information. A clearly defined problem statement guides the next steps in the 8D process, keeping the approach focused and effective for solving the issue.
D2.2 – The Problem Statement
A problem statement is a clear, concise description of an issue that needs to be addressed.
Making a good problem statement means showing the difference between what is expected and what actually happens. It is important to highlight standards and address one issue at a time.

Here are some easy steps to follow:
Define the Gap
Describe the specific difference between what was expected (the ideal standard) and what actually occurred. This should be a clear comparison showing where things fell short.
Example: “We expected to deliver a freshly baked Margherita pizza to the customer within 20 minutes, but it took 40 minutes due to an oven malfunction.”
Include a Standard of Good Results
Outline what the ideal outcome would look like to set a clear standard for success.
Focus on a Single Problem
Address only one issue at a time to keep the statement specific and manageable. If there are multiple issues, create separate statements for each.
Comprehensive Understanding through 5W2H
Use the 5W2H framework to gain a complete understanding of the problem:
- Who is involved? (e.g., “The kitchen staff and delivery team.”)
- What happened versus what was expected? (e.g., “The oven’s heating element failed, leading to delayed baking of pizzas.”)
- When did the issue occur? (e.g., “During the Friday night rush, when orders were at their peak.”)
- Where did the impact occur? (e.g., “In the kitchen, affecting all orders scheduled for delivery.”)
- Why is this a problem? (e.g., “Late delivery compromises customer satisfaction and may lead to complaints or loss of repeat business.”)
- How did it happen? (e.g., “The oven hadn’t been inspected recently, and a sudden malfunction occurred.”)
- How much is the impact? (e.g., “Five orders were delayed by 20 minutes each, risking negative reviews and refunds.”)
D2.3 – Best Practices and Common Mistakes
Generally, do not make assumptions or suggest solutions too soon in the problem statement. Wait until all needed information is collected and the main cause is found before deciding on the best fix.
This makes sure that choices are based on clear understanding of the issue and are not biased.
So the most common mistakes where redefining a problem statement are:

Problem Statement Too General
Sometimes, a problem statement can be too general without important details. When it’s too vague, it becomes hard to address well, as there is no clear path to find and fix the problem.
Cause and Effect Mixed Up
A problem statement talks about the reason for a problem instead of its effects. It is important not to discuss the cause in Step 2, since this step should focus on stating the problem itself and how it impacts users or customers. Step 4 is for looking into the cause, while Step 2 should explain the issue and its effects clearly.
Solutions Added to Problem Statement
Another frequent error is putting a solution in the problem statement. Including a solution too early can bias the way the problem is solved and may stop a full exploration of all possible solutions. Steps 5 and 6 are meant for looking into solutions and taking action, so it is important to keep the problem statement free of solutions until everything is fully understood.
Example
Problem Statement with Solution:
“Install a new oven system to resolve slow pizza delivery times.”
Revised Problem Statement:
“Pizza delivery times have increased during busy hours over the last month.”
More Detailed Problem Statement:
“In the last month, average pizza delivery times rose from 30 minutes to 45 minutes during busy hours (6 PM to 9 PM), impacting 70% of orders. This has led to a 25% rise in customer complaints and a 10% drop in repeat orders compared to the previous month. The issue is worst on Friday and Saturday nights, with some orders taking as long as 60 minutes.”

This improved statement:
- Measures the problem (30 to 45 minutes, 70% of orders)
- Sets the time period (last month)
- Shows when it happens (busy hours, 6 PM to 9 PM)
- Points out the impact:
- 25% rise in complaints,
- 10% drop in repeat orders
- Adds context (worst on weekends, delays up to 60 minutes)
D2.4 – Methods and Tools
The tools listed below often used for the 8D Report D2-phase, because the provide clear ways to gather data and analyze information about the problem:

5W2H
For the Problem Statement:
The 5W2H method is a straightforward approach for tackling problems and examining situations. It breaks down into seven essential questions: What, Why, Where, When, Who, How, and How much.
By addressing these questions, the method turns complicated problems into more manageable pieces, making it easier to grasp the full picture. Specifically, in quality control, the 5W2H technique proves invaluable for scrutinizing production defects or issues, streamlining the process of identifying and resolving them efficiently.
Is-Is-Not Analysis
For comparative Analysis:
The Is-Is-Not Analysis is a fundamental quality tool used to analyze and understand the root cause of a problem by examining the differences between what the problem is (Is) and what it is not (Is-Not).

This method involves comparing the situation where the problem occurs (Is) with situations where it does not occur (Is-Not), often using a test lamp or similar approach to highlight the contrast.
The tool is designed to gather comprehensive data, allowing for a clear comparison between the two scenarios. This helps in gaining a deeper understanding of the issue, facilitating more meaningful discussions and insights into the problem at hand.
Flowchart
For Process Analysis:
Flow charts in quality management serve mostly as a clear, visual aid for a process. This clarifies for teams how one action affects general quality. Flow charts help to identify inefficiencies, duplicate stages, and clarify roles and responsibilities by means of process mapping.

They serve mostly as a clear, visual aid for a process. This clarifies for teams how one action affects general quality. Flow charts help one to identify inefficiencies, duplicate stages, and clarify roles and responsibilities by means of process mapping.
Check Sheet
For Data Collection:
In data collecting and quality control, a check sheet—also called a Tally Sheet or Frequency Distribution Sheet—is a basic and efficient tool.
A check sheet, according to the American Society for Quality (ASQ), is a planned, ordered document for data collecting and analysis. This is a general data collecting and analysis tool with many applications. It can be modified for a great range.

It offers a methodical approach for entering and organizing quantitative and qualitative data for a given period at a certain location, therefore facilitating the analysis and pattern recognition.
Pareto Chart
For Data Collection:
Combining a bar chart and a line graph, a Pareto Chart is a graphic instrument used in statistical analysis and quality control. Driven by frequency or severity, each bar stands for a particular problem or cause. Emphasizing the most important aspects, the line graph shows the total influence.
Pareto Charts are named for the Pareto Principle that is commonly described as ”80% of effects come from 20% of causes.”

Control Chart
For Data Collection:
In quality control, a control chart—also called a shewhart chart or process-behavior chart—is a statistical instrument.
This graphical depiction tracks a process’s or system’s performance over time using a line chart, therefore indicating its variability. Control charts show data points, an average central line, an upper and a lower control limit.

Control charts were a first attempt in statistical quality control developed by Walter A. Shewhart in the 1920s while employed by Bell Laboratories.
D2.5 – Iterative Problem Definition
Solving problems is an ongoing process, which shows that understanding a problem changes with more knowledge is discovered rather than a one-time task.
Problem statements defined at the start of the 8D process can lack completeness or clarity. A problem cannot be adequately characterized until it is precisely understood.

D3 – Implement Containment Actions
D3.1 – Goal
“To set up, carry out, and check the success of short-term steps to keep customers safe from the problem’s effects.”
When a problem is identified, rapid actions are taken to limit additional issues or flaws. These actions act as a temporary solution, lessening the short-term damage to product quality or customer contentment. Containment measures may involve taking away affected items, stopping production, or implementing temporary fixes. The goal is to quickly address the problem’s visible signs, giving the team the time and chance to conduct a thorough investigation.

D3.2 – Purpose
Containment actions exist to protect customers from the results of a problem. These short-term solutions act like a “stop the bleeding” fix, giving teams time to look into the root cause and create lasting fixes.
Even though containment actions are needed, they usually are not a good long-term financial choice, so careful business decisions should be made about which actions to use. These quick fixes mainly focus on finding problems and aim to reduce impact instead of addressing the real cause.
It is important that containment measures stay in place until permanent corrective actions are fully put in place. The process should involve a full review of the product at each step of its development and production to make sure all possible issues are found and dealt with.
D3.3 – Containment Action Process
The Containment Action Process has several important steps, not just the action itself.
First, teams should pick the right kind of action using decision tools for good choices. A complete risk assessment is necessary during this choice phase to grasp possible outcomes.
After choosing the action type, the containment measure is put into place, and all involved parties must be informed about the changes quickly. Ongoing monitoring is important to ensure the containment action works well.
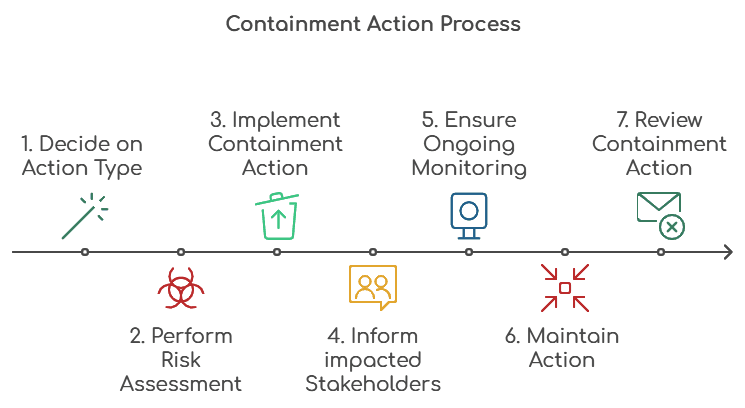
These steps should stay until a lasting solution is found and put into action. But it is absolutely important, that containment actions are not a long-term fix for a problem. In the end, teams need to assess the containment action’s effectiveness by looking at a few key things: how fast it was done, how well it worked, what resources were used, and any negative effects that came up. This thorough review helps enhance future containment actions.
D3.4 – Methods and Tools
There are different steps that can be done to contain quality problems.
Production lines might need to stop for a short time. Products that are not good should be stopped from getting to customers. Current products may need rework to meet the specifications. Sorting and rework processes must be done carefully in order to avoid follow-up defects, and special transport may be needed for affected products to avoid the interruption of the supply chain.

1. Production Stops
Stops in production are a most costly containment action, because they stop all manufacturing and hurt revenue. When a production line is halted, many costly issues follow: workers cannot work but still get paid, delivery dates get messed up, fixed costs keep adding up, and customer orders are delayed.
Also, getting production going again usually takes more time and resources to meet quality standards. While such stops might be needed in serious quality or safety cases, they should only be used after thinking about other options, due to their high financial costs to the company.

2. Product Blocks
Blocking products that seem suspicious is the second most costly action for protecting customers.
This is usually done when it’s hard to trace which items have bad parts. This method means putting many products, some of which are fine, in quarantine to make sure no bad ones get to customers. Costs add up fast because of storage, holding inventory, and possibly needing to make new products to fill customer orders. Without good traceability systems, companies must take this extra-careful step, stopping whole batches or ranges by date, which can cause big financial losses and halt supply chains.

3. Product Rework
Reworking products such as cars is a difficult and expensive task that requires to take NOK vehicles to service centers or factories for changes or repairs. This task needs a lot of resources, like skilled workers, repair shops, special tools, and spare parts. The rework process can vary from easy part changes to major system overhauls, each needing careful record-keeping and quality checks.
Costs can rise quickly when you think about not just the direct labor and parts, but also the costs of transporting vehicles, storage, customer inconvenience, and possible warranty issues. Even with these high costs, fixing is often better than completely blocking or recalling products, as it helps manufacturers directly address problems while keeping most cars on the road.

4. Sorting and Rework Parts
The most frequent and common activity taken to contain problems is sorting and repairing parts. It entails verifying and isolating poor from good components, then fixing the defective ones such they meet required criteria. Trained professionals who can detect parts that fall short of criteria by means of specialized regulations, measuring instruments, or testing machines should do this chore.

Sorting and reworking results in significant expenses even if it is less expensive than stopping production or blocking goods because of additional staff, specialized tools, dedicated space, and slower production speed. Maintaining detailed records helps to track changed components and guarantee quality. Sometimes sorting activities must take place at numerous points in the supply chain, including factories, warehouses, or supplier sites, therefore increasing the complexity and cost of the process.
5. Special Transports
Special transport in logistics means using different shipping methods or additional shippings from what is usual to deal with urgent needs. This can involve faster delivery options, like air freight instead of shipping by sea, or using special couriers to swiftly send replacement parts or keep customer supplies flowing even when there are quality problems. Although special transport tends to be cheaper than stopping production or holding back goods, it still leads to higher costs than normal logistics, especially with international rush shipments or dedicated vehicles for urgent needs.
Additionally special transport usually needs more planning, paperwork, and tracking to make sure important shipments arrive on time and that sensitive or quarantined items are handled correctly. Costs can rise quickly when these special steps are required over a long time before permanent solutions can be put in place.
D3.5 – Securing the Supply Chain
Containment actions need to cover the whole supply chain to take care of possible quality problems at important stages. It starts with raw materials, where checks and controls stop bad materials from getting into production. For semi-finished goods, watching and checking quality helps spot issues before bad products get more work done on them.

Finished goods need to go through careful checks and quarantine steps before they are sent out. And products that are already in the hand of customers might need special care or recalls. Supplier sites must also have containment steps to keep bad parts from being sent out, and attention is needed for materials and products that are being shipped either in or out.
The complicated nature of today’s supply chains means containment steps should happen together at all these places, with effective communication and record-keeping to make sure no bad products get through at any stage. This all-encompassing approach, though tough to handle, is crucial to protect the company and its customers from quality problems.
D3.6 – Containment Monitoring

The follow-up steps for containment actions include monitoring and checking with measurable data to confirm they work. This begins with a review of the containment measures used, looking at results against clear targets and indicators. Regular checks are important because containment actions need to stay effective until lasting fixes are in place.
Use particular instruments for decision-making and do continuous risk inspections in order to guarantee unambiguous evaluations and identify any new problems from the containment activities,
This procedure has multiple points to prove that the client is removed from flaws and that containment measures are not generating fresh issues, as the diagram shows. The process goes on with monitoring even after some success; containment measures are stopped only when corrections are totally finished and verified. This strategy guarantees that, until long-term solutions are found, temporary adjustments are robust.
D4 – Analyze Root Cause
D4.1 – Goal
“To find and check possible reasons by using the problem description and testing data to determine and confirm the main cause.”
Root Cause Analysis (RCA) is a key step in the 8D process where the team examines the primary reasons for the issue. It uses quality methods like Fishbone diagrams, 5 Whys, or Failure Mode and Effects Analysis (FMEA) to investigate the elements that cause the problem. The purpose is to identify the main cause rather than simply addressing surface level symptoms. A careful and accurate root cause analysis is essential for developing effective corrective actions and preventing the issue from recurring.
D4.2 – Process
The process starts with making a list of all possible causes. Teams come together to think of and write down every factor that might be linked to the issue.
After that, in a second step, teams narrow down the focus to the main causes, identifying which ones need more detailed study.
In the third step, teams look at how these main causes connect, reviewing information and patterns to see how different factors relate to the problem.
Finally, the last step is to find the root cause, often signified by a clear realization of the true problem source.


At the top of the funnel teams start by listing all possible causes, labeled from X1 to Xx, to create a full range of options that might relate to the problem.
As they go down to the next section, the focus sharpens. Teams gather data on the most important few causes, particularly looking at X2 and X4. This step makes sure that only the best possible causes are looked at more closely, saving time and resources.
In the next part, the analysis gets deeper as teams link the chosen causes (X2, X4) with the outcome variable Y. This analytical phase helps to clarify connections between possible causes and the problem seen, using data to support or dismiss ideas.
Finally, at the funnel’s bottom, the process finishes with finding the main root cause, marked as X*. This is the real cause for the problem, which has been figured out by carefully eliminating and confirming throughout the funnel process.
Overall, this method shows a scientific way to tackle problems and ensures that decisions are made based on solid evidence instead of guesses. Teams can come up with effective solutions that fix the real problem rather than just the surface issues by reducing many potential causes to one confirmed root cause.
D4.3 – Root Cause Analysis Tools

The framework below combines three main parts of improving processes. The tools for data analysis give numerical insights into how processes work and relate. Tools for collaboration and visualization help teams engage and see problems clearly, making sure all views are included. Lastly, measurement and performance tools check the process’s reliability and confirm any improvements.
This method makes sure problems are tackled in an organized way, using numbers and insights to create effective solutions.
Ishikawa / Fishbone Diagram
The Ishikawa diagram, known as the Fishbone or Cause-Effect diagram, is a useful visual tool for finding potential root causes of a problem by organizing them into main categories. The fishbone shape, with the problem at the “head” and different cause categories like bones, helps teams systematically look into all possible contributors to an issue.

Usually the diagram consists of six standard categories (6M): Man/People, Machine, Method, Material, Measurement, and Mother Nature/Environment. Each main branch has many sub-branches, which allow the problem solving teams to dive deeper into more specific potential causes. This method ensures that teams consider all parts of a process instead of jumping to conclusions about what may be causing the problem.
5-Why Analysis
The 5-Why Analysis is a systematic problem-solving technique where you repeatedly ask “why” five times to drill down from surface-level symptoms to identify the root cause of an issue. By forcing teams to dig deeper with each “why” question, this method helps prevent superficial solutions and addresses fundamental problems rather than just treating symptoms

Beginning with the issue, the method questions every response until a root cause is discovered. Should this primary cause be addressed, the issue should not resurfaced. This kind of inquiry helps teams avoid basing hasty decisions on only the outward problems instead of addressing the actual reasons.
Histogram
A histogram is a useful tool for visual analysis to show, how often data occurs with vertical bars. This helps teams to spot patterns, differences, and possible problems in processes. The statistical tool sorts numerical data into groups or intervals, which makes it simple to see where most values are and find any odd patterns or outliers.

Correlation / Scatter Diagram
A Correlation or Scatter Diagram is a type of graph which shows the link between two factors by placing pairs of numbers on a graph. Each dot on the graph stands for two values. The arrangement of these dots helps to show if there is a positive link (when one number goes up, so does the other), a negative link (when one number goes up, the other goes down), or no link.

In quality control, scatter diagrams are great for spotting possible cause-and-effect links. For instance, in a restaurant, you could plot cooking temperature against cooking time to see how these affect pizza crust quality. If the dots make a clear formation, it indicates a relationship that could help improve the process.
Control Chart
A Control Chart is a statistical tool that plots data points over time to monitor process performance and distinguish between normal variations and significant deviations requiring investigation. By establishing upper and lower control limits based on historical data, it helps teams quickly identify when a process goes “out of control,” making it an essential tool for quality control and continuous improvement.
Think of it like a heart monitor for your business processes – it shows the normal “heartbeat” of business operations and alerts when something unusual occurs that needs attention.
D4.4 – Tool Selection Guide
Choosing quality management tools for finding the root of problems should depend on how complicated and what kind of problem it is. If possible causes are known already from experience, the 5-Why method is often enough to identify and confirm the root cause.

Teams can use an Ishikawa diagram to investigate possible causes for simpler problems where the root cause is unknown and subsequently utilize either the 5-Why approach or Fault Tree Analysis for validation of the cause. In more complex situations when the causes are unknown, a combination of the 5-Why and Ishikawa approaches might assist to identify possible causes prior to more thorough investigation to validate them.
When facing problems with many factors and unknown causes, it is useful to first apply statistical methods to find possible correlations and patterns. These results can then be examined further with the 5-Why technique or Fault Tree Analysis to establish and verify the real root cause. This organized method ensures that teams apply the best tools based on the complexity and nature of the problem.
D4.5 – Root Cause Types: Occurrence vs. Escape
When looking at problems, the difference between occurrence and escape root causes is very important in quality control.

Occurrence looks at where the problem started – finding the local cause and putting in place steps to prevent it from happening again. This could mean to check manufacturing methods, how workers are trained, or the quality of materials where problems first happen.
Escape analysis looks at why existing detection systems did not find the issue before it got to the next step or to the customer. It investigates how defects moved through the system without detection and reviews failures in checks, quality procedures, or testing methods. Knowing escape root causes is important, because it helps to improve detection techniques and fix weaknesses in quality control systems.
The On/Off Method for Root Cause Verification
The On/Off Method is a practical way to find the true cause of a problem. It works through targeted tests where you:
- Add a suspected cause (turn it on)
- Watch if the problem occurs
- Remove the suspected cause (turn it off)
- Watch if the problem disappears
This method builds on a simple idea: The real cause of a problem must reliably trigger and stop the problem.

Example:
- If a computer crashes, you might suspect a certain program is at fault
- You start the program and watch if the crash happens
- You close the program and check if the computer runs normally
- If the problem only happens with the program running, you’ve likely found the cause
The biggest benefit of this method: It helps replace guesses with proof. Instead of guessing, you test what actually causes the problem.
D5 – Choose Corrective Actions
D5.1 – Goal
“Find, choose, and check long-term solutions that will remove the root cause(s) of the issue and stop it from happening again.”
Based on the results of the D4 root cause analysis, the problem solving team has to find and pick the best permanent corrections to adress the main root cause. The corrective actions have to be cost-effective as well prevent the issue from re-occurring. This involves selecting from several possible solutions, checking if they really fix the root causes, doing careful tests, and making sure there are no unexpected results. The team must also set clear measures to show, that the problem is really solved and keep a good cost-benefit balance. This might mean to change processes, to enhance quality checks or to come up with additional steps.
Corrective Actions are permanent.
The problem should not be able to reoccur.
D5.2 – Principles
In D5 the selection of permanent fixes should follow clear objective criteria, not just personal feelings or preferences. For instance, at a pizza place, new delivery choices should rely on facts like how much faster deliveries are, the cost for each delivery and how happy customers report they are.

Before implementation it’s crucial to verify the solution’s success. Each option should show it works based on solid data. For example, evidence that the new GPS system cuts delivery times by 15% over various locations and times is required.
It is important to test under normal working conditions in order to confirm that solutions are effective in real-life scenarios. A new process to prepare pizzas may seem fine during slow times, but must work effectively during busy Friday nights when the staff has to manage many orders at once.
Establishing clear indicators for continuous tracking support lasting success. This could involve tracking daily delivery times, the number of customer complaints, or the temperature of delivered pizzas. These KPIs should be straightforward to track, connect to the original issue, and fit into regular operations to ensure continuous improvement.
D5.3 – Process
When doing D5 of the 8D process, the problem solving team needs to come up with several possible solutions and look at each one to see how well it works, what it costs, and if it can be done. Once they pick the best solutions, teams must test and analyze these options to ensure they will really fix the root causes found.

Before any solution is put in place, teams must first conduct thorough testing in a controlled setting and then review the results carefully. This review should show that the solution works as it should in real conditions and that it does not cause new issues in the system.
It is very important to set clear performance indicators to measure how well the solution works. These indicators should be set before implementation and checked regularly to make sure the problem has been solved. For instance, if fixing pizza delivery times, metrics could include average delivery duration, the number of on-time deliveries, and customer satisfaction levels.
The last step must involve a cost-benefit analysis to make sure the solution is effective and also affordable in both the short term and long term. Only after meeting all these criteria should the team move on to fully implementing the corrective actions.
D5.4 – Action Selection Tools
When selecting and verifying corrective actions in D5, problem solving teams need to use a mix of analytical and decision-making tools.
This ensures, that solutions are well checked, correctly tested, and put into action effectively. These important tools assist teams in making clear decisions, looking at risks, confirming abilities, and watching ongoing performance. Below are the main tools and how they are used:

Brainstorming
Brainstorming lets teams think of lots of possible solutions without judging them at first. For instance, a pizza shop team might come up with ideas to improve delivery, such as using GPS, hiring more drivers, changing delivery bags, or implementing new routing software.

Decision Matrix
Decision Matrix allows teams to fairly compare options using weighted criteria. They might evaluate each delivery improvement idea based on factors like cost, how long it takes to implement, how effective it is, and how well staff accept it, helping to choose the best option overall.


Risk Assessment
Risk Assessment looks at possible issues with the suggested solutions. For each idea, teams check what might go wrong with probablities and impacts. For example if a new delivery routing system could break down during busy hours or if training drivers on new technology might slow down deliveries for a while.

Gage R&R
Gage R&R studies confirm if a measurement system is reliable. For example, testing whether various staff can measure pizza cooking temperatures consistently with new thermometers, making sure the readings are accurate regardless of who uses them.

Control Charts and Process Capability
Control Charts keep an eye on process performance over time, tracking important metrics like delivery times or pizza temperatures to quickly spot when processes go wrong and need fixing.
Capability Studies check if solutions can reliably meet needs.

D5.5 – Action Verification Tools
D5 verification of corrective actions needs a thorough testing approach that uses different methods to check if solutions work well.
This includes controlled lab tests, computer simulations, design checks, and full-scale production testing in real-world settings.

Simulation
Simulation allows to estimate performance and discover possible problems before real use. Potential delays or issues ahead of full-scale implementation can revealed by utilizing computer models to mimic different delivery situations, route choices, and busy-hour staff patterns. This helps the team to make changes and improve solutions before dedicating resources to actual changes.

Design Verification Testing
Design Verification Testing is about checking the technical aspects of solutions in controlled enviroments. For instance the pizza delivery service just might test the new GPS routing systems in a safe environment to ensure they work correctly, are accurate, and can connect with current systems before being used in the real world.

Production Validation Testing
Production Validation Testing transfers checking into everyday operating situations and tests solutions among normal business activities. This could mean to use the new delivery system during busy hours with regular employees to see how well it works under real-life challenges, including different traffic situations and order amounts.

Laboratory Testing
Laboratory Testing offers a close look at specific conditions where certain variables can be managed and tested. For example, testing new pizza delivery bags in a temperature-controlled setting to check how well they keep heat under various outside conditions and delivery times.

D6 – Implement Corrective Actions
D6.1 – Goal
“Implement the chosen corrective actions from D5, validate their effectiveness and integrate these solutions fully into standard operations while monitoring their performance over time.”
D6 implements and validates the solutions based on the detailed plan made in D5. For instance, in a pizza place, this could mean to put the new GPS devices in the delivery cars, to teach drivers how to use the new tools and to change staff schedules for busy times.
The implementation step must be watched closely based on data and checked in order to make sure the solutions work as intended. This means keeping an eye on important metrics like delivery times, customer satisfaction ratings and staff performance in order to confirm that the updates address the original problem without causing new problems.
Validation has to happen in real working conditions – not only when things are slow but also during busy times when systems and workers face the most stress. Any problems or surprises must be fixed quickly with needed changes before going ahead with full implementation. Only when the data shows consistently that the solutions work and are stable should they become part of the regular operating procedures.
D6.2 – Process
Dimension D6 of the 8D report requires a clear plan to lay out and organize permanent fixes. The problem solving team has to clearly define each corrective action with specific requirements and expectations.

For instance, for a pizza delivery service, this could mean to put a GPS systems in all delivery cars and to set up a new staffing model for busy hours with precise coverage levels.
After the actions are defined, it is important to assign specific duties with clear ownership and deadlines. In the Pizza example the IT Manager has to handle the GPS setup by June 1st, while the HR Manager is responsible for hiring drivers and launching the new schedule by May 15th. Resource requirements, like budget, training materials and technical support, have to be detailed out for each action.
In the immediate validation planning stage, the problem solving team has to set clear success KPIs, like achieving 95% of deliveries in under 30 minutes. They also need to develop specific ways to measure the daily delivery times and create validation checklists which cover the driver skills with new systems and staff levels during busy hours. A testing phase should be arranged before full launch, with feedback tools like driver surveys and monitoring customer satisfaction to confirm the corrections work effectively.
D6.3 – Validation Tools
When teams set up and validate corrective actions in the D6 phase of the 8D process, they should use various quality tools to make sure the solutions are strong, lasting, and solve the root causes to stop the problem from coming back. The tools are:
Failure Mode and Effects Analysis (FMEA)
FMEAs (Failure Mode and Effects Analysis) find possible failure areas in the new processes before they are started, allowing for preventive actions to be put in place.

PDCA (Plan-Do-Check-Act)
The PDCA (Plan-Do-Check-Act) process gives a way to use solutions, like making a new pizza delivery route plan, testing it in selected areas, checking how well it works by looking at delivery times, and making changes if needed.

Error Proofing (Poka Yoke)
Error Proofing (Poka-Yoke) adds physical or process barriers to stop errors, like using color-coded delivery areas or temperature-alert delivery bags that notify drivers if pizzas are too cool.

Process Flowcharts
Process Flowcharts show and explain the new steps, illustrating how orders go from being received to being prepared and delivered, pointing out important control spots and decision points.
Control Charts and Process Capability
Control Charts keep an eye on process performance over time, tracking important metrics like delivery times or pizza temperatures to quickly spot when processes go wrong and need fixing.
Capability Studies check if solutions can reliably meet needs.
Standard Work
Standard Work documents ensure things are done the same way by outlining detailed steps, like how to prepare dough or follow delivery methods.

D7 – Prevent Recurrence
D7.1 – Goal
“To change methods, tools, materials, and management practices to stop the same or similar problems from happening again.”
The objective is about stopping problems from happening again by changing different parts of the process, including tools, materials, procedures, and management practices. This connects to the ideas of continuous improvement and being proactive in solving issues in quality management.
After verifying corrective actions, the team works on steps to avoid the problem from coming back. This means updating standard operating procedures, improving quality control methods, and putting in place preventive actions to guard against similar problems later. The goal is to build a lasting solution that strengthens the organization’s processes and stops the problem from returning.
D7.2 – Main Areas of Prevention
D7 (Prevent Recurrence) works on three main areas and uses certain tools to keep improvements successful in the long run:
First, it aims to keep the improvements that have already been made by using Process Flowcharts to outline the improved procedures and Control Plans to ensure the new delivery system in a pizza restaurant runs well through regular checks, maintenance, and staff training. Standard Work instructions are utilized to keep daily operations consistent.
Secondly, preventive actions look at similar issues that could arise in the same work area by using Error Proofing and FMEAs. For example, if changes were made to speed up delivery times during dinner hours, these tools help find and stop possible problems after the same ideas are applied to lunch hours or special event catering.
Lastly, D7 spreads knowledge gained to other parts of the organization through organized documentation and sharing of best practices. The successful delivery methods from one location are noted in Lessons Learned documents and standardized through Process Flowcharts and Standard Work instructions. Then they are being shared across all restaurant locations in the chain. This approach includes sharing optimized route planning, scheduling for staff, and temperature control procedures throughout the organization to help stop similar issues from happening in other places.
D7.3 – Process
The seven steps of the Preventing Actions Process form a systematic framework to anchor improvements, avoid recurring errors, and promote organization-wide learning.
1. Sustain Gains: Sustainability is the cornerstone of every successful improvement. This step is about securing and anchoring the progress already achieved. This happens through continuous monitoring of performance indicators, regular reviews, and the creation of mechanisms that prevent the team from falling back into old habits. By institutionalizing the improvements, they become the new standard.
2. Update Procedures: Documenting changes is crucial for their long-term success. In this step, procedural instructions, work instructions, training materials, and other relevant documents are updated to reflect the new improved processes. Error prevention mechanisms should also be integrated and clear responsibilities defined so that all involved know exactly how the new process works.
3. Apply Improvements Locally: Successful solutions should not remain isolated. This step focuses on applying the lessons learned to similar problems within the same work area. It involves analyzing where similar challenges might occur and proactively implementing improvement measures to prevent potential problems before they arise.
4. Update FMEA: Failure Mode and Effects Analysis is a powerful tool for risk minimization. In this step, the FMEA is updated with newly gained insights to systematically identify similar causes of failure. This makes it possible to uncover weaknesses in related processes and significantly reduce the probability of future errors, especially when multiple causes can lead to a single failure mode.
5. Apply Improvements Globally: True process excellence emerges when improvements are shared across departmental boundaries. In this step, solutions are transferred to other areas of the organization that might be affected by similar problems. This requires effective communication between different teams and the adaptation of solutions to the specific needs of other departments, but leads to organization-wide efficiency gains.
6. Learn from Mistakes: Mistakes are valuable learning opportunities. This step involves an in-depth analysis of past problems to recognize root causes and patterns. By systematically investigating errors, teams can gain important insights that contribute to the development of more robust processes. This reflective practice promotes a culture of continuous learning and prevents the repetition of mistakes.
7. Share Learning: Knowledge multiplies when it is shared. The final step focuses on actively disseminating the insights gained throughout the entire organization. This can be done through best practice documents, training, knowledge databases, or community of practice meetings. Through the open exchange of successes and failures, the collective knowledge of the organization is expanded, leading to a culture of continuous improvement and innovation.
D7.4 – Preventive Methods and Tools
D7 (Prevent Recurrence) needs a complete range of tools and techniques that stop the problem from happening again in similar products or processes in the organization.

These tools make it easier to apply successful solutions, avoid mistakes, find potential risks, and gather knowledge for future enhancements. Each tool has a specific role in creating a strong prevention system:
Control Plan
Control Plans as a result of the FMEA outline what must be observed (like oven heat, delivery times, or food storage conditions), how often to check, who oversees it, and how to respond with a predefined reaction plan if checks go outside set limits.

Lessons Learned
Lessons Learned provide an insightful analysis of how to address delivery time issues including staffing policies during peak hours, route planning techniques or maintenance of equipment. Every restaurant has these observations recorded and shared to prevent similar issues going forward.

Standard Work
Standard Work provides clear, detailed instructions for key tasks like making dough, assembling pizza, cooking, and delivering. This ensures standards across shifts and sites.

FMEA
FMEAs look at what could go wrong at each step of making and delivering pizza. The problem solving team finds possible failures—like dough temperature changes or routing mistakes—and set up preventive actions before issues arise.

Error Proofing (Poka Yoke)
Error Proofing (Poka Yoke) sets up safeguards to avoid defects. Some examples are color-coded delivery areas on maps, temperature-sensitive delivery bags that warn drivers if the pizza gets too cold, or pre-measured ingredients to maintain pizza quality.

Flowchart
Process Flowcharts in D7 show improved pizza operations step by step, from taking orders to delivery. These visuals outline the sequence of tasks, decision points, and important control points. This makes it easier for staff to grasp and follow the better process.

D8 – Celebrate the Team
D8.1 – Goal
“To recognize all team members for their individual and group efforts and create an environment for ongoing improvements.”
The last step in the 8D process is to acknowledge the team’s efforts. Celebrating the resolution of the issue builds a culture of improvement and motivates team members to engage in future problem-solving. Recognition can take various forms, like formal acknowledgments, team awards, or other expressions of gratitude, highlighting the importance of teamwork and commitment to quality.
This discipline stresses the need to recognize both personal and team contributions while creating a setting that promotes continuous improvement. The key ideas emphasize the importance of including employees in management tasks and developing good communication skills to meet this goal.
8D-Report Due Dates – The 1-5-20 Rule
The 1-5-20 Rule sets critical timeline requirements for addressing quality issues:
- Within 1 Working Day (D1-D3): Immediate containment prevents defect spread Team formation and problem description completed Initial investigation and containment actions documented
- Within 5 Working Days (D4-D5): Complete root cause analysis using proven methods (5 Why, Ishikawa, etc.) Root cause verification through data analysis Permanent corrective actions defined with implementation plan
- Within 20 Working Days (D6-D8): Implementation of permanent corrective actions Effectiveness verification through data monitoring Preventive actions deployed across similar processes Team recognition and lessons learned documented
Benefits of the 8D-Report
Methodical Problem-Solving Approach
The 8D Report offers a methodical and organized way to solve problems, helping teams face challenges in a structured way. By dividing the problem-solving process into eight specific steps, this method gives teams a clear guide to use. This organized format promotes careful examination of problems and guarantees that corrective measures are applied thoughtfully, reducing the chances of missing important parts of the issue.

Improved Quality and Customer Satisfaction
A main advantage of using the 8D method is better product quality and higher customer satisfaction. By targeting the root causes of issues, organizations can fix problems where they start, resulting in more dependable and uniform product outputs. Consequently, customers face fewer defects, which boosts their satisfaction, trust, and loyalty to the brand or organization.

Prevention of recurring issues
The 8D method does more than just fix problems; it focuses on taking steps to prevent problems from happening again. By looking closely at root causes, organizations can take strong actions that not only fix the current issue but also strengthen processes to avoid future problems. This forward-thinking strategy helps reduce the chances of ongoing issues, supporting lasting product quality and better efficiency.

Continuous Improvement of Processes
A key part of the 8D Report idea is ongoing improvement. The method’s cyclical nature helps organizations learn from each issue-solving cycle and use these insights to improve their processes. This focus on continuous improvement helps the organization change and adjust to new situations, prevent potential problems, and keep a good level of operational quality.

Cross-Functional Teamwork
The 8D method requires making teams from different areas, which helps people work together who have different skills and knowledge.

This way of working allows for sharing ideas and insights from various departments, reducing divisions and encouraging a better understanding of the problems involved. The outcome is a more thorough approach to solving problems, boosted by the combined knowledge and experience of members from different areas in the organization. This teamwork atmosphere aids not just in solving problems effectively, but also in enhancing the overall sharing of knowledge within the organization.
Limitations of the 8D-Report
Requires Dedicated Resources and Time
A limitation of the 8D Report is that it needs committed resources and time. While the detailed approach is good for solving problems thoroughly, it can be a setback when quick action is needed or if an organization has limited resources. The extensive gathering of data, analysis, and carrying out corrective actions can take a long time, making the 8D process less practical for urgent issues.

Can Be Bureaucratic for Small Issues
The 8D method is meant to give a full way to solve problems but could seem too bureaucratic for small problems. When the issue isn’t complex enough, the 8D process might add extra steps and paperwork, which can slow down solving the issue. Organizations must find a balance between being thorough with the method and being practical to handle smaller problems effectively.

Depends on Team Skills and Analysis Accuracy
The 8D process works well based on the team’s skills. If the team does not have the right abilities, teamwork, or varied knowledge, solving the problem might fail. Also, the accuracy of the root cause analysis is crucial for the process to succeed. Mistakes or missed points in finding the main problems can result in poor corrective actions, weakening the 8D process overall. This highlights the need to form a capable team and carefully analyze the root cause to make sure the process succeeds.

Best Practices 8D-Report

Prioritize Communication and Teamwork
Good communication and teamwork are key to the success of the 8D method. Promoting open sharing of ideas among team members creates a collaborative space to use different viewpoints and skills. Regular team meetings, clear communication paths, and a common awareness of everyone's roles help make the problem-solving process more efficient and effective.

Foster Transparency and Accountability
Good communication and teamwork are key to the success of the 8D method. Promoting open sharing of ideas among team members creates a collaborative space to use different viewpoints and skills. Regular team meetings, clear communication paths, and a common awareness of everyone's roles help make the problem-solving process more efficient and effective.

Use Data-Driven Root Cause Analysis
Using data tools for cause analysis helps improve the accuracy and efficiency of the 8D method. Using tools like statistical analysis, Fishbone diagrams, or Pareto charts lets teams find and rank possible root causes in a more objective way. By depending on data instead of personal opinions, organizations can achieve a clearer understanding of the core problems, resulting in better-focused corrective measures.

Review and Update Processes Regularly
Improvement is key in the 8D method, and organizations need to use the insights from each problem-solving round. By regularly reviewing and updating processes guided by 8D insights, the organization can change and adapt to stop similar problems in the future. This approach not only enhances the team’s problem-solving skills but also fosters a culture of constant improvement. Regular feedback and process reviews help ensure that lessons from 8D reports become part of daily operations.
8D-Report vs. A3 Method
The 8D Report is a detailed formal method, made for finding the main cause of an issue and executing quick and long-lasting fixes with a team approach.
The A3 Sheet is easier and more visual, fitting with lean practices, often used for faster problem-solving processes where clear communication is important.

8D-Report vs. Continuous Improvement
In quality management, there are two main ways to tackle performance issues: the 8D problem-solving method and Continuous Improvement (CI). Both aim to improve performance, but they do it in different ways.
- The 8D Process: Reactive Fixing
The 8D method is used when performance is not as expected. This method has eight steps. First, a team is formed and the problem is defined. Then, preventive actions are taken to limit further issues. After identifying the root cause, lasting corrective steps are taken, and finally, measures to prevent future problems are established, along with team recognition. - Continuous Improvement: Proactive Growth
On the other hand, CI looks at situations where performance is acceptable but could be better. This method is proactive and focuses on innovation by using the Six Sigma DMAIC process. It works in cycles, promoting the ongoing improvement and optimization of processes.
- The 8D Process: Reactive Fixing
Key Differences:
1. When They Are Used
– 8D: Triggered by problems or deviations
– CI: Driven by chances for advancement
2. How They Are Implemented
– 8D: Has set, time-limited steps
– CI: Involves flexible, ongoing improvement cycles
3. Tools Used
– 8D: Concentrates on fixing issues
– CI: Uses DMAIC (Define, Measure, Analyze, Improve, Control) or A3 Thinking

Choosing the Right Method
Organizations need to choose the right method based on:
– Type of issue (problem vs. opportunity)
– Need for a quick solution
– Resources available
– Long-term goals
Both methods are important in today’s quality management and work together to help achieve better operations. Knowing when to use each method helps in making the best use of resources and effectively solving problems.
8D-Report Example: Pizza Delivery
Here is an example of how an 8D Report could be used for our Zero-Defect Pizzeria. This example deals with a common problem where pizzas are often brought to customers cold, which causes complaints.
8D Report for Zero-Defect Pizza
Problem: Cold Pizza Deliveries
Date: [Insert Date]
Report Author: [Insert Name]
Team: [Insert Team Members]

D0 – Prepare for the Process
Step: See that there is a need for fixing problems and lay the foundation.
Trigger:
Many customer complaints in the last two weeks about pizzas arriving cold.
Goal:
Find out why pizzas are cold and take actions to make sure all pizzas are hot when delivered.

D1 – Establish the Team
Step: Create a cross-functional team to address the problem.
Team Members:
- Delivery Manager
- Head Chef
- Customer Service Representative
- Delivery Drivers
- Operations Manager

D2 – Describe the Problem
Step: Define the problem clearly and measure its effect.
Problem Statement:
In the last month, 20% of complaints from customers have come from pizzas that were cold upon delivery. This has led to bad reviews online and a 5% decrease in orders from returning customers.
When and Where:
Most complaints happen during busy times (6-8 PM) and are notably higher for deliveries that take more than 15 minutes.
Impact:
Loss of income, lower customer satisfaction, and a damaged reputation.

D3 – Develop Containment Actions
Step: Take short-term measures to stop the issue from going on while looking into why it happened.
Containment Action:
Give more insulated delivery bags to drivers and tell them to inform management right away if any pizza stays in the kitchen for over 5 minutes after it is made.
Goal:
Keep pizzas hot during delivery while the investigation is ongoing.

D4 – Analyze Root Cause
Step: Find and confirm main issue using tools such as 5 Whys or Fishbone Diagram.
Main Root Cause Analysis:
1st Why: Why are pizzas coming cold? – Slow delivery and uneven preparation.
2nd Why: Why are deliveries slow? – Drivers often face delays from traffic or unclear paths.
3rd Why: Why are drivers not using best routes? – No real-time navigation help and bad teamwork between kitchen and delivery staff.
4th Why: Why is the kitchen not working with delivery drivers? – No communication system for when pizzas are done, causing pick-up delays.
Main Root Cause:
Bad teamwork between kitchen and drivers, along with poor route planning.

D5 – Find and Verify Corrective Actions
Step: Find long-lasting solutions to fix the root problem and make sure the fix works well.
Action 1:
Use an app that helps delivery drivers track routes and consider traffic.
Action 2:
Set up a system to inform drivers as soon as their order is ready for pickup.
Action 3:
Teach kitchen staff to prepare pizzas at different times during busy hours to prevent pizzas from waiting too long.
Verification:
Test the solution for one week during busy times, keeping an eye on delivery times and what customers say. If pizzas are hot and delivered on time, apply the system to all shifts.

D6 – Implement Corrective Actions
Step: Start corrective actions throughout the whole operation.
Implementation:
- App put on all delivery drivers’ phones.
- Notification system checked and set up in kitchen.
- Training meetings done for kitchen and delivery workers on new rules.
Date:
[Insert Date]
Responsible:
Delivery Manager and Operations Manager.

D7 – Prevent Recurrence
Step: Make sure the problem does not happen again by changing procedures and putting in place preventive actions.
Procedure Changes:
Standard operating procedures (SOPs) changed to add the new app and kitchen alert system.
Monthly reviews to check all drivers are using the app and that the kitchen-to-driver system works.
Training:
Continuous refresh training for both new and current staff.

D8 – Celebrate the Team
Step: Recognize team work and mark the achievement.
Recognition:
Organize a team gathering to express gratitude to all members for their hard work, especially highlighting the teamwork between kitchen workers and delivery drivers.
Rewards:
Provide a minor bonus or incentive for employees in the first month of successful deliveries post-launch.

Result
After the new methods and tools were used, complaints from customers about cold pizzas went down from 20% to 2%. Delivery speeds got better by 15%, and customers felt happier, which brought back some lost customers and made online reviews better.

8D Report – Real-World Examples
1. Pizza / Food Service
Customer Complaint Analysis
Professional 8D Report example from the food service industry demonstrating how to document and resolve customer complaints about delivery quality issues like wrong toppings, missing ingredients, and underweight portions using the VDA 8D methodology.
💡 Want to create your own? Contact me for the free template.

2. Automotive / Tier 1 Supplier
Bearing Failure Investigation
Automotive 8D Report example following VDA guidelines showing how to analyze premature bearing wear in transmission components, demonstrating proper use of 5-Why analysis (TUA, SUA, TUN, SUN) and systematic containment actions.
💡 Want to create your own? Contact me for the free template.

3. Pharma / Manufacturing
Tablet Coating Deviation
GMP-compliant 8D Report example from the pharmaceutical industry demonstrating how to document coating thickness deviations including batch quarantine procedures, laboratory testing, and CAPA implementation according to FDA requirements.
💡 Want to create your own? Contact me for the free template.

4. Service / Hotel Hospitality
Guest Complaint Resolution
Service industry 8D Report example showing how hotel chains can systematically analyze recurring guest complaints about room cleanliness, demonstrating how to apply structured problem-solving to improve customer satisfaction.
💡 Want to create your own? Contact me for the free template.

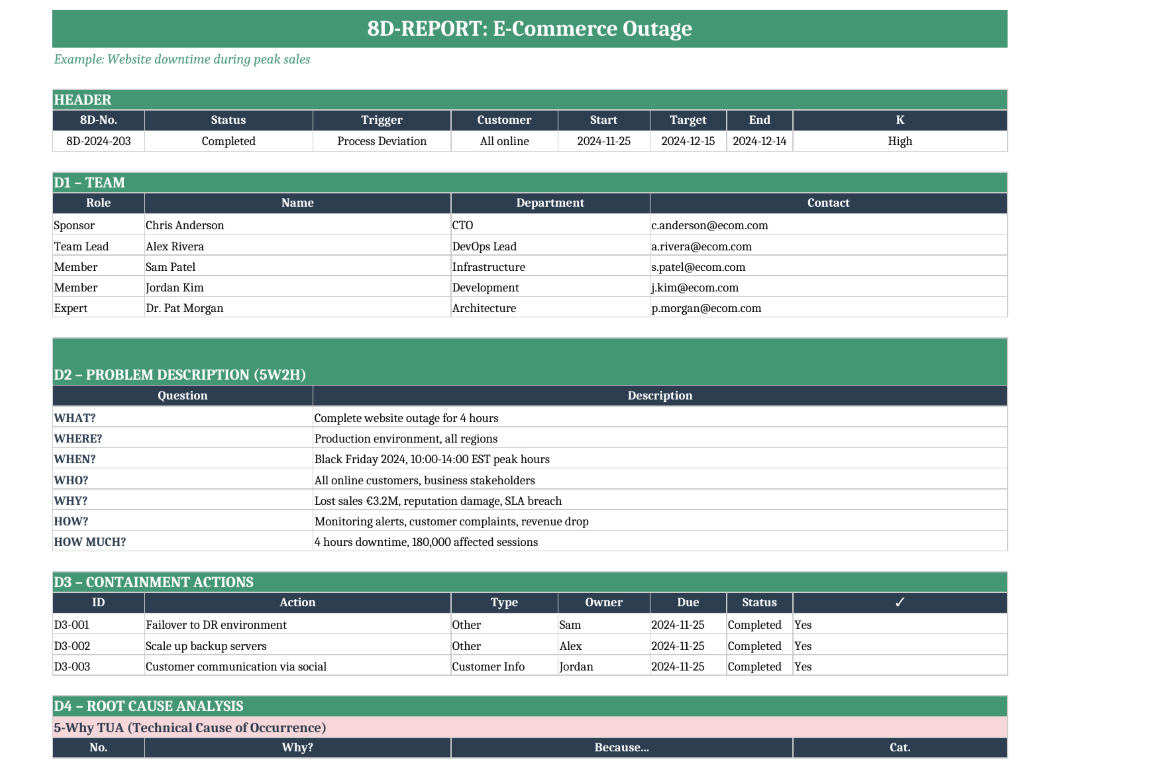
5. IT / DevOps
Website Outage Incident
IT/DevOps 8D Report example demonstrating how to document and resolve a critical e-commerce website outage during peak sales, including database connection pool analysis, failover procedures, and preventive monitoring improvements.
💡 Want to create your own? Contact me for the free template.
FAQ 8D-Report
What is a 8D-Report?
The 8D (Eight Disciplines) report is a structured process for identifying, resolving, and preventing problems. It is widely used in quality management to address defects, deviations, and customer complaints. The steps include team formation, problem definition, root cause analysis, corrective actions, and preventive measures.
When should the 8D-Report process be used?
The 8D process is reactive and best used when:
- There is a performance issue or deviation.
- The root cause of a problem is unclear.
- Immediate containment and long-term corrective actions are needed. Examples include addressing product defects, resolving customer complaints, or fixing equipment failures.
How is the 8D-Report process done?
- D1: Form the Team
- D2: Define the Problem
- D3: Implement Containment Actions
- D4: Conduct Root Cause Analysis
- D5: Develop and Verify Corrective Actions
- D6: Implement and Validate Corrective Actions
- D7: Prevent Recurrence
- D8: Recognize Team Contributions
What tools are commonly used in the 8D-Report process?
- Fishbone/Ishikawa Diagrams: For identifying possible causes.
- 5 Whys Analysis: To drill down to the root cause.
- Control Charts: To monitor process performance.
- Process Flowcharts: For visualizing workflows and improvements.
- FMEA (Failure Mode and Effects Analysis): To assess risks and prevent future issues.
- Pareto Chart: To prioritize the most significant problems or causes by frequency or impact.
- Histogram: To analyze data distributions and detect patterns or inconsistencies.
What are the benefits of using the 8D-Report?
- Structured Approach: Provides a clear and step-by-step process for problem-solving.
- Root Cause Identification: Focuses on finding and addressing the primary cause of an issue.
- Preventive Action: Ensures long-term solutions to prevent recurrence.
- Team Collaboration: Promotes cross-functional teamwork for diverse perspectives.
- Improved Quality: Enhances product or service quality by resolving defects effectively.
- Customer Satisfaction: Reduces complaints and improves customer trust by addressing and preventing issues.
- Knowledge Sharing: Facilitates learning and documentation for future reference.
- Continuous Improvement: Supports organizational growth by embedding a problem-solving culture.
What are the limitations of the 8D-Report?
- Requires dedicated resources and time, which may not be feasible for urgent or small issues.
- Can feel bureaucratic for minor problems.
- Relies heavily on team skills and accurate root cause analysis.
What are the best practices for implementing the 8D-Report method?
- Form a Skilled Team: Assemble a cross-functional team with relevant expertise and clear roles.
- Define the Problem Clearly: Use measurable terms to describe the gap between expected and actual performance.
- Use Data-Driven Analysis: Rely on tools like Fishbone Diagrams, 5 Whys, and FMEA to identify and verify root causes.
- Implement Containment Actions Promptly: Take immediate steps to protect customers while investigating the issue.
- Validate Corrective Actions: Test and verify solutions in real-world conditions before full implementation.
- Document the Process: Maintain detailed records of actions, findings, and results for future reference and training.
- Focus on Prevention: Update procedures, training, and systems to prevent recurrence of similar issues.
- Celebrate Team Success: Recognize and reward the team’s efforts to reinforce a culture of continuous improvement.
- Monitor and Measure: Use KPIs and control charts to track the effectiveness of implemented solutions over time.
- Communicate Transparently: Share findings, progress, and improvements across the organization to promote collaboration and learning.
Can the 8D-Report and Continuous Improvement work together?
Yes, both methods complement each other:
- 8D addresses immediate issues with a structured, corrective approach.
- CI focuses on ongoing optimization and preventive measures, often applying lessons learned from 8D.
What are the best practices for implementing the 8D-Report?
A3 Thinking is a lean, visual problem-solving method using a one-page report. While the 8D process is detailed and formal, A3 Thinking emphasizes simplicity, clarity, and communication. A3 is better suited for faster resolution and continuous improvement initiatives.