
8D Problem Solving (D2 & D4)

A3 Problem Solving

Before Process Changes

Cross-Functional Process Mapping

Error-Proofing (Poka-Yoke) Planning

Root Cause Analysis Setup

Quality Gate Definition

Process Documentation
New Employee Training
Identifying Bottlenecks & Waste
Procedure Writing


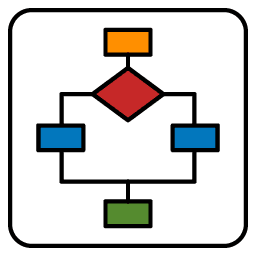
Simplicity
Simplicity is important for making a flow chart work well. It helps all involved parties see each step in the process clearly and without confusion. Each step should be shown in an easy-to-understand manner by breaking down the process into smaller parts and reducing complexity.
By keeping out extra details and concentrating on the main actions and decisions, a simple flow chart allows everyone—from operators to managers—to follow the steps without getting lost in too much information. This simplicity not only makes it easier to use but also helps quickly spot problems, facilitating efficient fixes and process enhancements.
This ends up providing organizations the definition of what is broken, or what could be made better resulting in effective planning and execution becoming a necessity — to aim all the efforts towards effective results.ess more efficient and effective.

Clarity
Standardized symbols are vital for keeping clarity in a flow chart. They help ensure that everyone reading the chart interprets it in the same way. Common symbols, like rectangles for tasks, diamonds for choices, and ovals for starting and stopping points, form a shared way to show processes.
When symbols are used correctly and consistently, readers can follow the process easily, without needing lengthy explanations. This clarity helps avoid confusion and misreading, especially in complex processes, as the standard symbols allow anyone familiar with basic flow charts to understand the workflow clearly.

Systematic Approach
A systematic approach is essential for making a flow chart an effective tool for analyzing processes. By outlining the process from beginning to end, the flow chart captures all important steps, decisions, and possible delays, providing a full view of the workflow.
This complete view allows teams to examine the process in detail, uncovering areas of inefficiency, repetition, or possible mistakes. By organizing the process clearly, the flow chart aids in structured problem-solving, where every step can be evaluated, improved, or adjusted to enhance overall performance and quality.


Ishikawa Diagram

5-Why Analysis

Pareto Chart

Control Chart

SIPOC Diagram

Poka Yoke

Action Management

FMEA
Lessons Learned
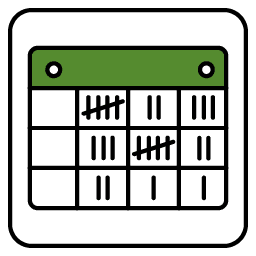
Check Sheets (Tally Sheets)

8D Report

Control Plan
Value Stream Mapping (VSM)

Standard Work
Better Process Understanding

Standardizing Processes

Better Communication

Finding Issues

Over-Simplification
Static Representation

Time-Consuming


Start High-Level, Add Detail
Starting with a broad overview is a smart way to create a flow chart, giving a clear view of the main steps before going into more details. This technique helps outline the overall framework and flow without making the chart too complicated at first. After laying down the basic process, you can add extra details as needed, concentrating only on parts that need more examination.
This method keeps things clear and avoids overwhelming information, allowing stakeholders to understand the main flow and look deeper into specifics when required, aiding both overall understanding and detailed process improvement.
Use Standard Symbols
Using standard symbols in flow charts is very important for making sure that everyone can understand them easily across different teams. For example, rectangles show tasks, diamonds represent decisions, and ovals indicate the start or end points. This provides a common visual way of communicating that doesn’t need extra explanation.
Keeping this uniformity reduces confusion, especially when various team members or stakeholders look at the chart quickly. Standard symbols also make communication smoother, as all can concentrate on the process itself instead of trying to interpret new visuals, making the flow chart a useful tool for working together and sharing knowledge.

Validate with Stakeholders
Getting input from stakeholders is a key part of guaranteeing the flow chart’s accuracy and usefulness. Involving team members who are part of or manage the process helps gather insights on any steps that might have been overlooked or any details needing clarification.
This joint review process helps build agreement, as stakeholders can confirm that the chart accurately shows real-world operations. Evaluating with stakeholders also makes the chart more functional, as adding their feedback makes it more relevant and useful for the team's needs. Involving stakeholders guarantees that the flow chart is a reliable reference, which is important for aligning the team with standard processes and quality goals.

Keep it Simple
Simplicity is crucial for creating a flow chart that is easy to understand and work with. By concentrating on key steps, decision points, and vital actions, you can prevent the chart from becoming too busy with unnecessary details that might reduce clarity. A straightforward flow chart is easier to read at a glance, making it more beneficial for quick reference and effective communication.
Prioritizing simplicity helps team members navigate the chart without confusion, making sure the main goal of understanding and improving processes is met. Clear and simple flow charts are more likely to be used often, aiding ongoing quality improvement efforts efficiently.
Ishikawa Diagram

5-Why Analysis

Check Sheets
Pareto Diagram