Find Root Causes Visually
The Fishbone Diagram (Ishikawa Diagram) is a visual tool that reveals every possible cause of a problem across 6 categories: Methods, Machines, Materials, Manpower, Measurement, and Environment. This video shows the 4-step process from problem definition to root cause prioritization, using a pizza quality problem as a complete example.
You'll learn: The 6Ms framework • 4-step visual process • Team collaboration techniques
Video Transcript
Have you ever been stuck in a bad situation and you just can't seem to find a way out of it? You could be facing a problem at work or even in your relationship and you have no clue what to do next because you do not really know the real root cause for your trouble.
Well, today I will show you a tool that can help you solve any problem.
This is called the fishbone diagram, also known as the Ishikawa diagram or cause-effect diagram. Originally developed in the 1960s, this is a visual tool and process that you can use to perform a root cause analysis on any problem.
The tool was invented by Kaoru Ishikawa and later integrated into many quality control methodologies such as TQM (Total Quality Management).
So what exactly is this tool useful for? The diagram is primarily used for problem solving and quality management. It helps teams within an organization to investigate all the possible causes of an incident or problem, not just the directly obvious ones.
So now let's explore how this problem solving process works. The very first step is to identify the problem that you need to solve as a team. You need to state it in clear and specific terms and to make it measurable if possible.
This is the head of the fish which goes at the right end of our diagram. This problem will be the focus of the entire discussion. Just think of a pizzeria facing the issue of inconsistent pizza quality.
So our problem statement at the head of the fishbone is: "Increasing customer complaints due to inconsistent pizza quality."
The next step is to list all the possible root causes of this problem. These should be added as the branches of the diagram. A few questions can be asked within the group to identify these causes.
The causes usually fall under six big categories: Methods, Machines, Materials, Manpower, Measurement, and Environment. These are the bones of the fish diagram, branching from its main bone.
The third step is to identify specific causes within each category, breaking it into smaller bones. This will require in-depth discussion by the team to specifically address all possible causes.
So for our example, under the Materials category, we can list the quality of ingredients and their expiry as possible causes for the pizza not being up to standard.
Under People, we can list inexperience and new staff as it is possible that some employees are not sufficiently skilled. Under the Environment category, we could list the temperature and conditions under which the pizzas were made.
Now that the diagram is finished, the final step is to try and identify the most important root causes that need to be solved. Here it would be helpful to start ranking causes by their order of importance and placing them on the diagram accordingly.
Other tools like the five-Why analysis can also be used as a great step to drill down the root causes even further. Once they are identified, the team can start looking for solutions to help solve the problem.
For our example, we could identify the quality of the pizza dough as an underlying cause to be investigated as this is likely the main factor for inconsistent pizza quality.
Now that we know the basic concepts of this fantastic problem-solving tool and have worked through an example, let's discuss all the benefits of using it.
Firstly, it allows a thorough analysis of the problems facing any organization. The fishbone or Ishikawa diagram lets the team go through all the possible causes that might be responsible for the issue at hand.
This systematic approach makes sure that nothing is missed or overlooked, giving it a higher chance of pointing out the real issue.
Another benefit of this diagram is the teamwork and collaboration involved which is an essential part of any organization. This not only encourages participation by all members and helps them cooperate as a team, but it also improves the quality of the analysis itself.
The diverse range of opinions from people involved is more likely to help pinpoint the root causes. Each member will bring their skills and experience.
Finally, a major benefit of the diagram is its ease of use. It is visually friendly, allowing anyone to understand how it is used. Even people who are not familiar with such methods can easily adapt to it and use it independently.
But as with anything, the benefits also come with some limitations. While the structured approach of the diagram is good with simpler issues, if the problem is very complex, the diagram can become harder to follow.
As the diagram aims to address all possible causes, it will become very large for more complicated issues. The diagram also risks focusing on direct causes within a few categories while ignoring larger and more systematic issues which may not be directly visible.
Finally, another limitation of the diagram is that it relies on having a very knowledgeable team. The team approach can only work if the people are experienced enough to analyze the possible causes.
In order to overcome these limitations, the management should try to bring experienced people from many different departments to help identify the problem.
The diagram can also be combined with other approaches like the five-Why analysis in order to understand the actual reason behind each cause and to get a more complete picture.
Overall, the fishbone diagram is a very useful tool to help organizations do root cause analysis. That's it for this video. Let us know in the comments what you think about this method.
What
A Fishbone Diagram, also known as the Ishikawa Diagram, is a visual tool used by teams to perform root cause analysis. It looks like a very skeletal fish. A central “spine”, with several “bones” coming off it. Each bone indicates a possible category of causes for some specific issue.
In the 1960s Kaoru Ishikawa originally developed this tool in Kawasaki shipyards. It was integrated into Total Quality Management (TQM) and subsequently other quality control methodologies.
Ishikawa / Fishbone Diagram Quick Guide
This guide helps you use the Fishbone Diagram to find root causes faster and prevent defects from happening again.
Test Your Ishikawa / Fishbone Knowledge
Test your understanding with 10 quick questions about the Ishikawa method. A simple way to review key ideas and see how well you can prevent defects from happening again.
The Ishikawa Diagram as Relationship-Counselor
Discover how the Ishikawa method helps you find the real causes behind recurring issues and prevent them from coming back — in love and in marriage.
When
Primarily used in quality management and problem-solving, the fishbone diagramm is very useful in quality management and problem solving as it ensures that a team systematically investigate all the possible causes of a problem, not just the ones whose absence caused incident. It is generically applicable across industry and for product or process improvement.
Why
The Ishikawa Diagram is used to identify, explore, and display the many potential causes of a problem so that problem solving teams can focus on its real root causes. This helps in identifying appropriate solutions and then taking the necessary steps to rectify them.
Principles
There are multiple principles on which the Ishikawa Diagram functions and helps in identifying the root causes of a problem. These principles are essential for the successful use of the tool in quality management and problems solving:

Categorization
The main rule of the Ishikawa Diagram is to classify causes. It means categorizing causes into high level groups, usually the 6Ms (Methods, Machines, Materials, Manpower, Measurement and Environment) in manufacturing or the 4Ps (Policies, Procedures. This categorization serves as a step-wise structured approach to identifying places where the root cause might be residing.

Cause-and-Effect Relationship
The Ishikawa diagram rests on the principle that problems (effects) are derived from multiple causes. This diagram helps in taking a systematic approach by mapping these causes and their sub-causes, so that the cause and effect relationships can be visualized in order to better understand from where the problem starts.

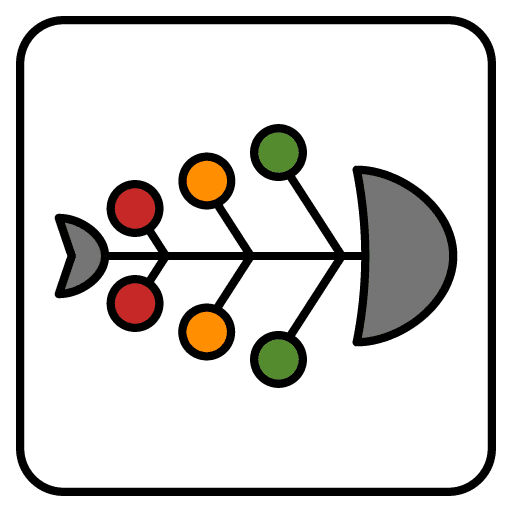
Visual Representation
Being visual is one of the main and essential principles behind this. By using the fishbone structure, it converts detailed relationships between the causes and problem into a simple form that can be easily understandable. This particular visual is used for working with the team and other stakeholders.

Iterative Exploration
The Fishbone diagram is not a linear or one-off tool. Instead it is enabling iterative exploration. Teams are then urged to revisit and perhaps refine the diagram as new information becomes available or if initial hypotheses about causes are tested and proven or disproven.

Focus on Root Causes
Ishikawa Diagrams are meant to get past just seeing the symptoms and take us all the way down to root cause. In this process, you ask why for all potential causes that are current and then take it further until you hit at the same time at the underlying root causes. It diverts the interest from treating symptoms to addressing the cause.

Holistic Approach
It is a problem-solving tool which takes a systemic approach to addressing causes of the problems. Looking at causes in more than one set of categories helps prevent the analysis from missing any potential dark corner where that root cause is hiding. This holistic overview is crucial for understanding complex problem systems.
How To
1. State the problem
Define the Problem when making an Ishikawa Diagram, the first thing you need to do is define what are you working on.
This statement needs to be specific, measurable, and brief. Put this statement at the ‘Head’ of the fish, generally speaking on the right side of your diagram. This is the central point of the entire exercise, which will help keep the group´s discussion and analysis around this (and only) area.
2. List possible roots
When you have your problem, all we need is to ask a few question to identify the cause. All causes fall under big groups such as 6Ms — Methods, Machines, Materials, Manpower, Measurement, and Environment for manufacturing. These categories are the “bones” branching from the central “vertebrae” of a fish. During this stage, a broad spectrum of possible causes should be considered without rejecting any ideas too quickly.
In a production environment, this category includes all the methods, systems, and approaches of completing tasks. It covers working guidelines, operating policies, process flows, and set processes.
In manufacturing, this describes all tools, equipment, and technology applied. It covers production equipment, automated systems, computers, maintenance tools, and any tool used in manufacturing or inspection of products.
This component addresses all manufacturing raw materials, components, parts, and supplies. It covers both direct components used in the finished good and indirect components aiding in manufacturing. Among material factors are quality, availability, storage, handling, and uniformity of inputs.
Manpower covers all human resource concerns including operators, technicians, supervisors, and support personnel engaged in manufacturing. It looks at staffing levels, skills and training, work schedules, ergonomics, and human factors influencing production.
This covers the physical surroundings and elements influencing manufacturing activities. It covers building layout, temperature, humidity, lighting, ventilation, cleanliness, safety issues, and occupational organization. Process results and worker performance can be much influenced by environmental elements.
Measurements focus on the systems of inspection, testing, and quality control applied to keep an eye on and validate outputs and production processes. It covers gauges, sensors, testing tools, statistical process control, and any means of gathering and evaluating production data to guarantee that quality criteria are satisfied.
3. List root causes
When listing root causes, a systematic approach is crucial, similar to the fishbone diagram. This methodology allows teams to look beyond superficial symptoms and identify the true problems.
To effectively list root causes:
- Collect all possible causes without premature evaluation
- Categorize by areas (Personnel, Processes, Technology, Environment)
- Examine interactions between different causes
- Evaluate each cause according to probability and impact
- Verify through data analysis or targeted investigations
4. Analyze root causes
Analyze the finished diagram to discover possible root causes It requires the analysis of different constraints and their dynamics to determine what can impact the problem.
You need to find high traffic areas, repetition and patterns of themes that indicated there may be critical underlying issues. It may result in the team needing to rank some causes as higher priorities for further investigation or using other problem-solving tools (e.g., 5 Whys analysis) to go deeper. Without this, you are stuck with symptom identification only.
5. Derive actions
The identification of the underlying causes from the analysis marks the beginning of the process of deriving specific actions that successfully solve problems. This entails giving the most important elements affecting the issue top priority and creating doable solutions to minimize them attention.
Teams may have to implement targeted process improvements, better resource management, or fresh ideas if they want to halt repeating issues. Moreover, using rigorous ways for problem-solving—such as the 5 Whys —helps to polish strategies of action.
Benefits
Encourages Thorough Analysis
The Ishikawa Diagram in itself provides all the tools that are used for a thorough study of the problem at hand. To sum it all up, systematically dividing the potential cause categories into numerous branches and then going down the drill to get to as many specific factors as possible will make sure that all bases are considered. This level of detail is vital to avoid missing important issues and guarantees a proper understanding of the problem, hence enabling a higher probability to pinpoint the real causes.
Promotes Team Collaboration
One of the key strengths of the Ishikawa Diagram is its ability to foster collaboration among team members. The process of creating the diagram encourages input from individuals with diverse expertise and perspectives, facilitating a multi-dimensional analysis of the problem. This collaborative environment not only enhances the quality of the analysis but also promotes a sense of ownership and consensus among team members regarding the identified causes and solutions.
Easy to Understand and Use
The Ishikawa Diagram is one of the most visually friendly tools which makes it suitable for all members of an organization. For example, its clear problem statement appears at the head of a fish bone shape, whose causes branch out like bones and therefore helps users quickly grasp what put it there in an intuitive and participatory way. Such is the importance of this ease of use, as it enables those team members not necessarily familiar with more complex analytical tools to participate in a broader problem-solving process at large.
Identifies the less obvious causes
The Ishikawa Diagram is especially useful for making visible reasons that are not intuitive at first sight. Breaking down the problem into a comprehensive level of categories and sub-factors that creates a systematic approach by peeling layers off the raw substance/native-content to understand deeper layers. This way it is possible to identify the real root cause of your problems (often ones that are hidden and you would never think of when doing a less structured or superficial analysis), leading to more valuable and sustainable solutions.
Limitations
Complex for Complex Problems
Though the Ishikawa Diagram is good with a structured approach, it can become a bit cumbersome and too complicated when dealing with problems that are quite complex. The size of the diagram can converge towards becoming very large, making it difficult to keep clarity and level of detail.
This very complexity often makes it difficult for practitioners to decide what areas are the most important, and can be much too powerful a tool when novice users dive in.
Risk of Ignoring Deeper Systemic Challenges
An Ishikawa Diagram tends to emphasise immediate or proximate causes of a problem. Yet this focus also risks a neglect of the more deep-seated, structural issues that inform these behaviors.
These systemic issues might be things that need to have greater organizational change from the top down or require a more coordinated approach to resolution. Consequently, there is a danger of the diagram directing efforts at 1–2 particular causes.
Needs a Knowledgeable Team of Persons
For using the Ishikawa diagram to be effective, the team specifically needs to be from an area of problem knowledge and be experienced in root cause analysis. However, this is almost entirely dependent on the team’s ability to pinpoint and group likely causes correctly.
Without sufficient expertise and experience, we will misdiagnose root causes of the issue at hand, forget to account for some important variables or misunderstand how pieces fit together — all leading us down a path where our efforts may be for naught or potentially do more harm than good.
Best Practice

Engage Departments
Engage not only with people from the same department but also from across multiple departments or business units to make fish-bone / Ishikawa Diagram more meaningful. Every member brings different insight and perspective from their own expertise and experience.
This diversity enriches the brainstorming process, leading to a more thorough investigation of possible root causes. It also reveals cross-departmental collaboration, which could reveal interdepartmental issues that might be causing the problem; thus offering a more holistic solution.

Keep Asking "Why?" to Delve Deeper into Causes
A central concept in harnessing the power of the Ishikawa Diagram is to keep asking WHY? for each possible cause identified. This is sometimes called the 5 Whys technique and serves to dig through surface-level symptoms to root causes.
By continuing to ask why this cause exists, the team can separate learned effects from identified causes and get to the very bottom of what is causing our problem. This type of iterative questioning is an essential check against shallow analysis.

Combine it with Other Tools such as the 5-Whys for Complete Analysis
The Ishikawa Diagram is a great tool by itself but when combined with other analytical tools such as the 5 Whys, Pareto Analysis or poducts using Six Sigma methodologies, results can be more robust and effective.
You can take this further by using the Ishikawa Diagram in conjunction with these tools to get additional depth and breadth of analysis. Also, the 5 Whys can be followed for each branch of the fishbone diagram to fully investigate all root causes. The dramatic use of both approaches would have helped a lot in data analysis because each tool is best suited for the type of problem being solved, and taken together they form a more complete picture.
Pizza-Example
Problem: Inconsistent Pizza Quality (Over-/Undercooked Pizzas)
To address the issue of inconsistent pizza quality, Zero-Defect-Pizza pizzeria uses a fishbone diagram (also known as an Ishikawa or cause-and-effect diagram) to identify potential root causes.
Inconsistent Pizza Quality:
Under-cooked or Over-cooked.
The team categorizes possible causes into major factors such as
- Methods,
- Machines,
- Materials,
- Man (People),
- Mother Nature (Environment), and
- Measurements.
3.1. Methods (Processes)
Incorrect baking time:
Staff may not be following the recommended baking times consistently.
Rush hour pressure:
Pizzas are being baked too quickly due to high demand, leading to shortcuts.
Inconsistent pizza assembly:
Different levels of topping or cheese thickness may lead to uneven cooking.
3.2. Machines (Ovens)
Oven temperature fluctuations:
Ovens may not be calibrated correctly, leading to uneven baking.
Oven 2 malfunction:
One specific oven may have inconsistent heat distribution or heating element issues.
Inconsistent oven cleaning:
Buildup of residue inside the oven may impact the heat flow.
3.3. Materials (Ingredients)
Dough inconsistency:
If the dough isn’t prepared or proofed consistently, it could affect baking time.
Frozen vs. fresh toppings:
Using frozen toppings might cause uneven cooking compared to fresh ingredients.
Moisture content in ingredients:
High moisture ingredients like vegetables or cheese may affect cooking time and lead to uneven baking.
3.4. Man (Staff)
Inexperienced staff:
New or less experienced employees may not have mastered oven operations or time management.
Inconsistent training:
Staff might not have received uniform training on baking techniques and quality checks.
Human error:
In busy times, staff might misread orders, use wrong settings, or bake pizzas improperly.
3.5. Mother Nature (Environment)
Ambient temperature:
Fluctuations in kitchen temperature might impact oven performance.
High-volume workflow:
During rush hours, high demand could lead to rushed procedures and mistakes.
Space limitations:
Limited kitchen space may cause inefficiencies, especially during peak hours.
3.6. Measurements
No consistent measurement system:
Baking times and temperatures may not be standardized across ovens.
Lack of real-time monitoring:
Staff may not be consistently checking oven temperature and pizza progress during baking.
No feedback loop:
Lack of post-bake quality control checks (e.g., temperature probes or visual inspection).
Fishbone Diagram Overview
The fishbone diagram allows the pizzeria to identify and categorize various potential root causes of inconsistent pizza quality, from methods and machines to people and materials. The next step would involve investigating the most likely causes (e.g., oven calibration, staff training, or baking times) and addressing these areas through corrective actions.
By breaking down the problem in this structured way, the pizzeria can focus on key improvement areas, such as training, oven maintenance, and process optimization, to reduce the inconsistency in pizza quality.
Based on the Root Causes identified Zero Defect Pizza decides on implementing the following actions:
Implement the process changes:
- Oven calibration: Maintenance is conducted to ensure that oven temperatures remain consistent. A weekly calibration schedule is introduced.
- Ingredient distribution: The company introduces an automated system for applying sauce and cheese in precise amounts, ensuring consistency.
- Employee training: A training program is rolled out to ensure employees perform quality checks before pizzas are packaged and shipped.
Quality control improvements:
- New quality control checkpoints are added at multiple stages (before baking, after baking, and pre-packaging) to catch defects earlier.
- Clear SOPs (Standard Operating Procedures) are created, outlining the steps for maintaining quality standards during production.
After several months of these improvements:
- Defect rates drop from 10% to 1% in the Margherita pizza line.
- Customer satisfaction increases, as reflected in positive reviews and fewer complaints.
- Sales grow, with repeat customers returning for consistent, high-quality pizzas.
- Profitability improves due to reduced waste, fewer returns, and lower rework costs.
- The company gains a reputation for high-quality, reliable pizza, attracting new customers.
FAQ
What is an Ishikawa / Fishbone Diagram?
The Ishikawa or Fishbone Diagram is a visual tool used in quality management for root cause analysis. It visually maps out potential causes of a problem in categories, resembling a fish’s skeleton, to identify root causes systematically.
What is the history of the Ishikawa Diagram?
Developed in the 1960s by Kaoru Ishikawa in the Kawasaki shipyards, this diagram has become a fundamental tool in Total Quality Management (TQM) and other quality control methodologies.
What is the objective of using an Ishikawa Diagram?
The objective is to comprehensively identify and explore potential causes of a problem and visually display them, aiding in pinpointing the root causes for effective solution implementation.
How is the Ishikawa Diagram used?
The diagram is used to identify and categorize potential causes of a specific problem in a structured manner. It’s widely used across industries for problem-solving and quality improvement processes.
What are the key principles of the Ishikawa Diagram?
The diagram operates on principles like categorization of causes (6Ms or 4Ps), visualization of cause-and-effect relationships, team collaboration, iterative exploration, focus on root causes, and compatibility with other tools.
How is an Ishikawa Diagram created?
Start by identifying and placing the problem at the head of the diagram. Brainstorm and categorize potential causes, drill down into specifics for each category, and analyze the diagram to identify root causes.
What actions should be derived from an Ishikawa Diagram?
After analysis, derive corrective actions to address the identified root causes, including specific solutions, responsible parties, and implementation timelines.
What are the benefits of using an Ishikawa Diagram?
It encourages thorough analysis, promotes team collaboration, is easy to understand and use, and helps in identifying not-so-obvious causes of a problem.
Are there limitations to the Ishikawa Diagram?
Yes, it can become complex for intricate problems, risk overlooking deeper systemic issues, and requires a well-informed and experienced team for effective use.
What are some tips and tricks for using the Ishikawa Diagram?
Involve team members from different departments for diverse perspectives, continuously ask “Why?” to dive deeper into causes, and use it alongside other tools like the 5 Whys for a more comprehensive analysis.