What Is a Check Sheet?
A Check Sheet, also known as a Tally Sheet or Frequency Distribution Sheet, is a simple and effective tool used in quality control and data collection.
According the American Society for Quality (ASQ) a check sheet “is a structured, prepared form for collecting and analysing data. This is a generic data collection and analysis tool that can be adapted for a wide variety of purposes.”
It provides a structured format for recording quantitative and qualitative data for a specific time at a specific place and organizing these data, making it easier to analyze and identify patterns.
If the check sheet is used for collecting quantitative data, it is usually called a Tally Sheet.
The Check Sheet was first introduced by Kaoru Ishikawa, a pioneer in quality management and the creator of the Ishikawa Diagram. It gained popularity as part of Total Quality Management (TQM) methodologies.
Check Sheet – Real-World Examples
1. Pizza Production
Daily Pizzeria Operations
Complete check sheet industry example for food service. Shows systematic defect tracking applied to pizza quality: 18 defect types captured over 10 days including cold delivery, burnt crust, and uneven topping. Data analysis identified delivery cold as main issue (23% of 62 total defects). Immediate actions: insulation bags, route optimization, and packing checklists implemented.
💡 Want to create your own? Contact me for the free template.
2. Automotive / Manufacturing
Final Assembly Line
Complete check sheet industry example for automotive manufacturing. Shows IATF 16949-compliant defect collection for assembly operations: 18 defect types tracked including paint scratches, gap deviations, and missing screws. Analysis revealed paint scratch as main defect (27% of 84 total). Countermeasures: handling training, fixture calibration, and supplier escalation.
💡 Want to create your own? Contact me for the free template.
3. Pharmaceutical / Life Sciences
Sterile Filling Line
Complete check sheet industry example for pharmaceutical production. Shows GMP-compliant deviation tracking for sterile filling: 18 defect types documented including fill volume OOS, particles in solution, and seal integrity failures. Root cause: dosing unit calibration (17% of 52 total defects). CAPA actions: cleanroom audit, equipment calibration, and supplier qualification.
💡 Want to create your own? Contact me for the free template.
4. Service Industry
Customer Service Center
Complete check sheet industry example for service operations. Shows systematic quality tracking for call center: 18 defect types captured including wait time >5 min, forgotten callbacks, and SLA breaches. Data revealed wait time as critical issue (40% of 144 total defects). Improvements: staffing optimization, CRM process redesign, and IVR enhancement.
💡 Want to create your own? Contact me for the free template.
5. Information Technology
IT Operations / DevOps
Complete check sheet industry example for IT operations. Shows structured incident tracking for cloud infrastructure: 18 defect types monitored including login failures, API timeouts, and performance issues. Analysis identified login failed as main incident (44% of 194 total). Resolution: AD sync optimization, connection pooling, and enhanced monitoring dashboards.
💡 Want to create your own? Contact me for the free template.
Check Sheet Types
Classification Check Sheet
Definition:
The classification check sheet is used to categorize data, helping in identifying patterns or frequencies of certain categories.
Objective:
It’s often used in situations where data can be observed and collected repeatedly into different categories.
Examples:
Tally Sheet
Definition:
Tally Sheet — Used to record specific events, occurrence or defect and programmatically count (→) frequencies. This type of check sheet is the simplest form; you just add a mark (a simple tally) for each time a particular event or defect occurs.
Objective:
The Tally Sheet is useful for identifying frequent problems that occur as well as repetitive activities, over a predetermined time.
Example:
-
At Zero-Defect Pizza, a surge in online orders and expanded delivery coverage has led to growing customer complaints, prompting the management to implement a detailed tracking system.
Over a week-long period, the data revealed critical issues including weekend delivery delays, inconsistent food preparation, and order accuracy problems. Armed with this concrete data, management can now make targeted improvements in staffing, training, and equipment maintenance to enhance customer satisfaction.
Location Check Sheet
Definition:
A Location Check Sheet is used for writing the physical location of failures on a location check sheet. Normally, it includes a picture and/or drawing of the object which is being inspected and defects are marked on this picture.
Objective:
A Location Check Sheet can be extremely helpful in picturing how defects are concentrated across space, which is crucial as aggregate locations of defects may help us identify sources of problems in production.
Example:
-
In the food service industry, a location check sheet involves a diagram of a pizza. As defects (like crust thickness issues, missing toppings, or cooking problems) are found, their positions are marked on the pizza diagram, helping identify patterns or problem areas in the production process.
These observations can help to identify issues in preparation procedures, staff training needs, or equipment problems. For example, clusters of burnt spots in one area might indicate uneven oven heating, while missing toppings in certain sections could reveal the need for improved topping distribution techniques.
Measurement Scale Check Sheet
Definition:
Measurement Scale Check Sheet:This type is used to detect tendencies or patterns and can, like the Attribute Check Sheet, replace a process that relies on memory; unlike other check sheets (especially attribute check sheet) which focus primarily on qualitative data such as absence or presence of defects.
Objective:
Purpose: To capture quantitative data during the process in actual numerical measurements (such as dimensions, weight, time, temperature etc) in a structured manner. It helps guarantee that the measurement of products or components reaches a particular quality standard by documenting and analyzing the measured data against pre-set limits or tolerances. This has been built up to enable a simple pinpointing of trends, spotting of outliers and measurement-related defect root causes which will all help create a stable quality product and improved processes.
Example:
Check List
Definition:
The Check List is a form of a is check sheet with a list of items or steps that need to be completed or verified
Objective:
A Check List ensures that all necessary actions in a process have been taken.
Examples:
- In aviation prior to takeoff the pilots go through a pre-flight checklist process to ensure that all systems of the aircraft are working correctly. Such tests include, engine performance, instrumentation testing, safety equipment and communication system checks.
- Assembly line workers in manufacturing require a production checklist to ensure that all product components are assembled properly and compliant with quality standards before moving on to the next stage. Some examples of these steps are ensuring every part is accounted for, verifying alignment, inspecting fasteners for security and checking parts for defects or inconsistencies
- A patient care checklist is a great way to help ensure all medical procedures and tasks are completed for each patient while nurses run through their shifts in healthcare. Administering medication, taking vital signs, updating charts, maintaining patient comfort and safety.
When to Use a Check Sheet
Check Sheets are highly useful in manufacturing and service industries as well as in quality management in order to collect information about processes for monitoring them and controlling, defect data collection or defect (problem) identification as they allow
- to gather data and make observations.
- to easily visualize the frequency of observations in a numerical format.
- to differentiate facts from opinions.
So they are very useful tools at the following situations:
Defect Frequency Tracking
When you need to know HOW OFTEN specific defects occur, Check Sheets provide the answer. Instead of guessing which problem is biggest, you count – and let data drive priorities. Every tally mark builds your case for action.
Process Baseline Establishment
Before improving a process, you need to know its current state. Check Sheets establish the baseline: “We currently have 127 defects per week across 8 categories.” Without this baseline, you can’t measure improvement.
8D Report Data Collection (D2)
Step D2 of the 8D process requires problem quantification: What? Where? When? How big? Check Sheets provide the structured data collection that makes D2 complete. Without data, your 8D stays superficial.
Six Sigma Measure Phase
The DMAIC Measure phase demands baseline data. Check Sheets are the simplest tool for attribute data collection – counting defects, categorizing failures, establishing current sigma level before improvement begins.
Root Cause Preparation
5-Why and Ishikawa work best when focused on the RIGHT problem. Check Sheet data tells you which defect deserves root cause analysis. Spending hours analyzing a defect that occurs twice monthly while ignoring one that occurs 50 times daily wastes resources.
Shift & Time Comparisons
When you suspect time-based variation – morning vs. afternoon, weekday vs. weekend, summer vs. winter – Check Sheets with time columns prove or disprove your theory. The structure forces consistent recording across all periods.
Supplier Quality Monitoring
Incoming inspection needs documentation. Check Sheets track defects by supplier, by part number, by delivery – building the evidence base for supplier scorecards, quality agreements, and sourcing decisions.
Problem Quantification for Management
“We have quality issues” doesn’t get budget. “We have 847 defects per month costing $23,400 in scrap” does. Check Sheets convert quality concerns into business language that management understands and acts upon.
Why Use a Check Sheet?
The main aim or objective of using a Check Sheet is to systematically record the data. Hence it becomes very useful for the team to identify trends, issues and instead be able to have an informed decision-making process when looking at how they can improve their processes.
Check Sheet Principles
What follows are the guiding principles of successful Check Sheet data collection, requiring clear categories, standardization, real-time recording and accuracy in combination to provide insights that can support decision-making.

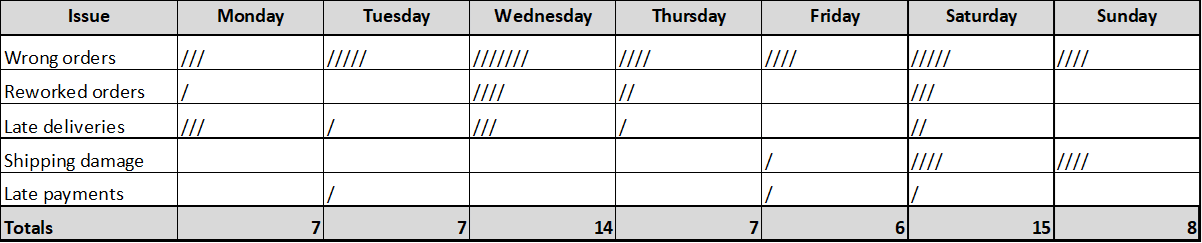
Standardization: Consistent input of data with a standard format and symbols
Check Sheet must be in Standard format to collect the data uniformly. It involved recording data using a common standard format and predefined symbols or notations. In this way, you guarantee that other researchers will use the same methods, and hence the change of misinterpretation or human errors decreases. For example, if you add a “+” symbol about count aggregations then all data collectors in the team must continue to follow this standard practice to preserve the canonical state of data.

Defined Categories: Define what data goes into what category
The one of the basic principles for Check Sheet is to define categories for data collection. Categories: These categories need to be clear and based on the data that is being collected. Think of it as categories: if you are tracking defects in a manufacturing process, your categories might be "scratches," "dents," and "misalignment." Well defined categories help in effective classification and counting of the data leading to suitable organization of information which can further be analyzed reliably.

Real-Time Data: Record Data on the fly
One of the Basic Principles of a Check Sheet is the Real-time Data Capture. Can writing about things that are happening, when they are fresh? This method reduces the probability of memory bias or omitting some vital information. For instance, if you are in a customer service environment and logging customer complaints remember to log every complaint as soon as it is reported and not at the end of the day. In this way, the information collected will be as accurate and current as possible.

Precision: Confirm precise tabulations + recording
One of the components that are vital in Check Sheet is accuracy. In order to be consistent with this principle, data have to be counted and recorded in a systematic and error-free manner. This is done with exact counting and turning them all into price tags in the appropriate categories. To avoid this, you should always conduct accuracy checks and quality control on a regular basis. If you are tallying event occurrences, an occasional but careful count of the marks can help to verify that you have reliable, usable data.
How to Create a Check Sheet
1. Specify the Purpose
All good data handling starts with a clearly defined purpose for your Check Sheet. You need to determine the critical information/handful of data points you want to grab. The first of which, is simply asking those necessary things you need to achieve or monitor or improve. For instance, if you are in charge of a restaurant and need to increase customer service, your goal may be customer complaints. The purpose enables you to create a foundation for the entire data collection process so you can capture the right, most actionable data.
It often involves data collection, customer feedback analysis, and root cause analysis. By conducting a thorough assessment, organizations can determine the scope and significance of the problem or opportunity, setting the stage for targeted and effective improvement efforts.
2. Design the Sheet
Once you have determined your purpose, the next step is to actually construct the Check Sheet. It’s about engineering the perfect vehicle to align with your purpose. On the sheet, you would normally draw columns or – if it made sense for the specific data points to capture- categories. However, in an issue-based system — like tracking defects in a manufacturing process — each column could be a different type of defect.
A good sheet is one that makes it simple to take the data and put it in a consistent place every time!
3. Collect Data
After your purpose and Check Sheet design is done, you can then start to collect data. As any data-events (customer complaints, defects or anything relevant) happen mark it in the corresponding category on the sheet. You could take a mark in the “Food Quality” category as an example of when a customer reports food quality issues in the restaurant. It is critical that the data collection process be consistent and accurate to ensure that the collected data properly represents what actually happens in context.
4. Analyse Data
Once you have captured enough data, the last step in the process is analysis of that data. This includes reviewing the data, and providing an explanation as to what these numbers might infer. Once you have collected your data, it is easy to then run totals, percentage or other stats –timestamps make this easy as shown above. If you consider the example of a restaurant, you could analyse customer complaint data to understand the trends (top 10 types of complaints and peak times of complaints).
How to Combine Check Sheets with Other Quality Tools
Ishikawa Diagram
Check Sheet identifies WHICH defect is most frequent; Ishikawa explores WHY it occurs. First, use Check Sheet to find your biggest problem. Then, use Ishikawa to brainstorm its causes. Data-driven focus prevents wasted analysis effort.
5-Why Analysis
After Check Sheet reveals the top defect, 5-Why drills to root cause. The combination ensures you’re asking “why?” about the right problem – the one that actually impacts quality most, not the one that’s most visible or vocal.
Pareto Chart
Check Sheets collect the frequency data; Pareto Analysis visualizes it. The Check Sheet answers “how many of each?” – Pareto shows “which vital few matter most?” Together, they transform raw counts into prioritized action.
Action Management
Each defect category on a Check Sheet can link to an action item. “Surface scratches: 47 this week → Action: Implement handling training by Feb 15.” Check Sheets identify gaps; Action Management closes them.
CAPA Management
Recurring issues on Check Sheets become CAPA triggers. When the same defect appears week after week despite fixes, it’s time for formal Corrective and Preventive Action. Check Sheet trends provide the evidence for CAPA initiation.
Control Chart
Check Sheets track attribute data (defect counts); Control Charts track variable data (measurements) over time. Use both: Check Sheet for “how many bad?” and Control Chart for “how much variation?” Complete process monitoring requires both views.
8D Report
Check Sheets support multiple 8D steps: D2 (problem quantification), D4 (root cause data), and D6 (verification data). The same Check Sheet format can track defects before AND after corrective action – proving your solution worked.
Stratification
Stratification means separating data into meaningful groups. Check Sheets with multiple columns (by shift, by machine, by operator) enable stratified analysis. The structure you design into your Check Sheet determines what stratification is possible later.
Histogram
Check Sheet data can feed Histograms when you’re tracking measurement categories. If your Check Sheet columns are measurement ranges (e.g., “0-5mm”, “5-10mm”, “10-15mm”), the totals become histogram bars showing distribution shape.
Cost of Quality (CoQ)
Multiply Check Sheet defect counts by cost-per-defect, and you have failure cost data. “234 rework events × €15/event = €3,510 internal failure cost.” Check Sheets feed directly into CoQ calculations.
Benefits of Using a Check Sheet
Simplicity: Easy to create and use
One of the greatest Check Sheet advantages is its easy and straightforward use. Check Sheets are easy to construct and use, they do not need particular training or resources. This easy-to-use tool enables data collection with high efficiency for users of different aptitude levels. The simplicity of its design allows teams to concentrate on the data instead of complex data gathering processes, which makes it one of a kind when you consider the benefits companies derive from effective quality control and process improvement.
Visibility: Provides a visual representation of data
Check Sheets offer a visual representation of data, making it easier for teams to grasp information at a glance. The organized format of Check Sheets with clear categories and tally marks or symbols allows for quick comprehension of data trends. Visualizing data in this manner enhances transparency within an organization, as team members can readily see the status of processes or identify any anomalies. This visual clarity aids in communication and decision-making, streamlining the path to improvement.
Identify Trends: Helps in identifying common issues or patterns
One of the key advantages of using Check Sheets is their ability to help identify trends and patterns in data. By consistently recording occurrences in predefined categories, teams can spot common issues or recurring problems. This capability is invaluable in quality control, as it enables organizations to pinpoint root causes and take proactive steps to address underlying issues. Identifying trends early allows for timely intervention and process optimization.
Data-Driven Decisions: Supports evidence-based decision-making
Check Sheets promote data-driven decision-making by providing a reliable and structured method for data collection. The data recorded on Check Sheets offers empirical evidence of what is happening within a process or system. This evidence-based approach empowers organizations to make informed decisions rather than relying on assumptions or guesswork. Whether it’s improving product quality, customer service, or operational efficiency, Check Sheets lay the foundation for well-informed, strategic choices.
Cost-Effective: Requires minimal resources
Another notable advantage of Check Sheets is their cost-effectiveness. Implementing Check Sheets doesn’t necessitate significant financial investments or complex technology. With basic materials like paper and pen, or even digital templates, organizations can create and utilize Check Sheets. This affordability makes Check Sheets accessible to businesses of all sizes and industries, enabling them to harness the benefits of data collection and process improvement without breaking the bank.
Check Sheet Limitations
Subjectivity: Data collection may be influenced by the recorder
One limitation of Check Sheets is the potential for subjectivity in data collection. Since individuals are responsible for tallying or marking occurrences as they happen, there is a risk that personal biases or interpretations may influence the recorded data.
For example, different recorders may categorize events differently or have varying thresholds for what constitutes an occurrence. This subjectivity can introduce variability into the data, making it less objective and potentially less reliable for analysis. To mitigate this limitation, organizations should provide clear guidelines and training to ensure consistency among data collectors.
Limited Analysis: Check Sheets are best suited for simple data
Check Sheets are most effective when used for straightforward and relatively simple data collection tasks. They excel at capturing counts or frequencies of occurrences within predefined categories. However, they may fall short when dealing with more complex data that requires detailed measurements, qualitative assessments, or multi-dimensional analysis.
For instance, when analyzing highly variable or multifaceted data sets, Check Sheets may not provide the depth of information needed to understand underlying factors fully. In such cases, organizations may need to complement Check Sheets with more sophisticated data collection methods and tools.objective and potentially less reliable for analysis. To mitigate this limitation, organizations should provide clear guidelines and training to ensure consistency among data collectors.
Not for Complex Data: Inadequate for highly detailed or complex information
A significant limitation of Check Sheets is their inadequacy for handling highly detailed or complex information. Complex data often involves numerous variables, intricate relationships, and nuanced measurements that Check Sheets are ill-equipped to capture.
For instance, in scientific research or advanced statistical analysis, Check Sheets may not provide the level of detail required for in-depth investigations. Attempting to use Check Sheets for such complex scenarios may result in oversimplification and the loss of critical nuances. To address this limitation, organizations should recognize the boundaries of Check Sheets and consider alternative data collection methods for complex data sets.
Check Sheet Best Practices
Here are key best practices around using Check Sheets efficiently:

Teach the staff how To collect the data
However the key way to get max benefit from Check Sheets is to train your staff on data collection. Consistency and accuracy are crucial for data collection, and we train everyone on the procedures, categories, & symbols used on your Check Sheet. Training also helps in reducing the subjectivity and errors in data recording Organizations can increase data collection accuracy and congruence with intended purpose of the Check Sheet by investing in staff training.

Deploy digital Check Sheets using software
Even just using software to create and maintain the Check Sheets digitally can bring huge efficiency gains on time, otherwise spent re-entering the data from paperwork. Digital Check Sheets bring several benefits such as faster data entry, true real-time updates, instantaneous calculations and immediate report generation which comes with a dashboard! It speeds up the analysis and enables faster decision-making as well. In addition, they minimise the human error of manually keying in data and allow for remote data collection giving organizations efficiency and accuracy in their data management.

Update and review Check Sheets regularly
Check Sheets will continue to be effective as long as they are consistently reviewed and updated. Processes expand over time and due to this the older data may be obsolete. So, a regular review of the Check Sheet's categories, symbols and methods of collecting information is essential to keep them consistent with the goals and intentions in your company. Updating and validating Check Sheets mean that the data collected using these tools are always fresh in case you need them for future process improvement initiatives. This also leads to the possibility of integrating feedback from data collectors into the tool in subsequent rounds.
Check Sheet Example: Pizza Quality
At Zero-Defect Pizza check sheets are used to monitor various aspects of the production process, ensuring quality control and consistency. Here’s how:
1. Ingredient Preparation Check Sheet
Objective:
The Ingredient Preparation Check Sheet ensures that all ingredients are prepared and portioned correctly before being used in pizza production.
| Ingredient | Target Weight/Amount | Actual Weight/Amount | Check (Yes/No) |
|---|---|---|---|
| Dough Ball | 250g | 248g | Yes |
| Tomato Sauce | 100g | 98g | Yes |
| Mozzarella Cheese | 150g | 150g | Yes |
| Pepperoni Slices (for pepperoni pizzas) | 30 slices | 28 slices | No |
2. Baking Quality Check Sheet
Objective:
Ensure that pizzas are baked uniformly with no undercooked or overcooked areas, and ingredients like cheese are properly melted.
| Pizza Type | Oven Temp | Baking Time | Crust Color | Cheese Melting (Yes/No) | Defects (Yes/No) | Notes |
|---|---|---|---|---|---|---|
| Margherita | 230°C | 12 minutes | Golden | Yes | No | Perfect |
| Pepperoni | 230°C | 12 minutes | Dark Brown | Yes | Yes | Overcooked crust |
| Veggie | 230°C | 12 minutes | Golden | No | Yes | Cheese not fully melted |
3. Packaging Check Sheet
Objective:
Confirm that each pizza is packaged correctly, sealed, and visually inspected for any defects before dispatch.
Benefits:
- Consistency: Ensures each pizza is made with the right quantity of ingredients and baked to the correct specifications.
- Quality Control: Early detection of issues (such as undercooked pizza or missing toppings) prevents defective pizzas from reaching customers.
- Efficiency: Helps streamline the process by keeping track of key steps and eliminating common errors.
As shown check sheets help standardize operations, ensure quality control, and improve customer satisfaction by consistently delivering properly made pizzas.
| Pizza Type | Correct Box (Yes/No) | Box Sealed (Yes/No) | Visual Check (Yes/No) | Defects (Yes/No) | Notes |
|---|---|---|---|---|---|
| Margherita | Yes | Yes | Yes | No | – |
| Pepperoni | Yes | Yes | Yes | No | – |
| Veggie | No | Yes | Yes | Yes | Wrong box label |
FAQ Check Sheet
What is a Check Sheet or Tally Sheet?
A Check Sheet is a simple data collection tool used to record and organize data in a structured format for a specific time at a specific place, typically with predefined categories and tally marks or symbols.
Where can Check Sheets be applied?
Check Sheets can be applied in various industries, including manufacturing, healthcare, and services, to monitor processes, track defects, and gather data for quality improvement.
What is the main objective of using a Check Sheet?
The primary objective of a Check Sheet is to collect data systematically, facilitating the identification of trends, issues, and opportunities for process improvement.
Who introduced the Check Sheet as a quality tool?
The Check Sheet was first introduced by Kaoru Ishikawa, a prominent figure in quality management and the creator of the Ishikawa Diagram.
What are the core principles of using a Check Sheet?
The core principles include
- defining clear categories,
- standardization of data entry,
- recording data in real-time, and
- ensuring accuracy in counting and recording.
What are the steps to using a Check Sheet effectively?
The steps involve
- defining the purpose,
- designing the sheet,
- collecting data by tallying or marking occurrences, and
- analyzing the data to draw insights.
What are the benefits of using Check Sheets?
Check Sheets offer
- simplicity in data collection,
- provide a visual representation of data,
- help identify trends,
- support data-driven decisions, and
- are cost-effective in their implementation.
What are the limitations of Check Sheets?
Limitations include
- potential subjectivity in data collection,
- suitability primarily for simple data, and
- inadequacy for handling highly complex or detailed information.
What are best-practices for using Check Sheets effectively?
Best-practices for check sheets include
- training staff in data collection procedures,
- using digital Check Sheets for quicker analysis, and
- regularly updating and reviewing Check Sheets for relevance.